Automating Monitoring & Alerting Infrastructure with Terraform
At ilert we embrace infrastructure as code and try to automate our processes whereever possible. This might reach from niftly little bash scripts to fully blown Terraform projects that spin up whole environments with as little as terraform apply on a CLI.
With Hashicorp’s Terraform you can make use of infrastructure as code to provision and manage any cloud, infrastructure, or service. Terraform can be extended to use third party services with the help of Terraform Providers hosted in the Terraform Registry.
Lets see how we can use the Grafana Terraform Provider and ilert Terraform Provider to setup an automated metrics alert which will trigger a phone call alert during support hours.
Requirements
You will need:
- a Mac / Unix machine
- an ilert account signup now, its free
- potentially Docker (if you have no running Grafana setup)
Grafana setup instructions
Note: in case you already have a running Grafana instance ready to go, you can skip this step.
However if you do not have one handy and you want to quickly explore your options, we have provided you with a docker-compose setup, that you can use to spawn an instance quickly.
- clone our sample repository git clone git@github.com:iLert/terraform-grafana-alerting-sample.git
- cd terraform-grafana-alerting-sample
- run docker-compose up
- your Grafana instance shold be running at http://localhost:3000
ilert setup instructions
Usually you would setup your ilert users and notification settings in ilert directly or through SSO providers in larger applications. However for the sake of this Terraform showcase, we will create all resources e2e in Terraform including the user and his settings.
Terraform setup instructions

Lets install Terraform first you can grab a copy here or install with tools like brew e.g. brew install terraform.
Verify your proper installation with terraform -v in your shell. You should see something like this: Terraform v0.13.5.
Understanding Terraform
First of grab the source code for this post if you haven’t already: clone our sample repository git clone git@github.com:iLert/terraform-grafana-alerting-sample.git and navigate into it cd terraform-grafana-alerting-sample.
You will see the following files and folders:
Providers
This file describes the required providers for our setup, as well as maps their required variables e.g. credentials to access Grafana or iLert.
Resources
These files describe the resources of the third party services e.g. the grafana alert or the iLert alert source that will be managed for our alert to create incidents.
Variables
This file holds all of our variables which are needed to setup or resources.
Docker-compose files
We have provided these in case you have no running Grafana instance handy, these are otherwise not required and are not related to Terraform.
Automating infrastructure
Let’s see how we can roll out our infrastructure.
Preparing project
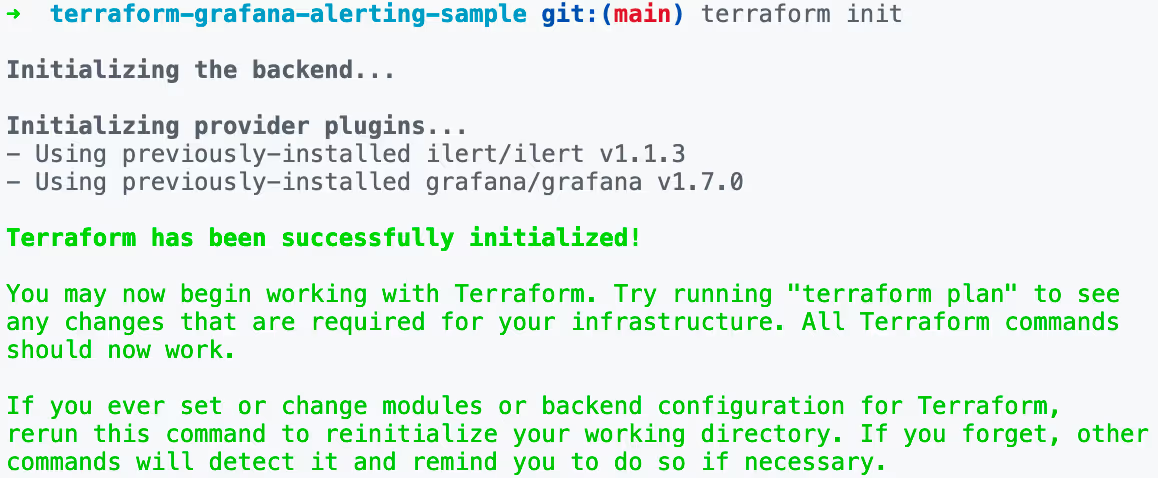
Before we can apply the wanted changes to the services, we have to initialize our Terraform project. This will prepare Terraform e.g. fetch all of our declared providers (Grafana and ilert), as well as prevalidate the syntax of our provider files.
Simply run terraform init and you should see an output like this:

Applying changes to services
For our sample we have additionally configured some handy environment variables for you to pass on the dynamic arguments even more flexible (make sure to change them to your needs):
You should see cli output like this:

Trigger test alert
You are now able to trigger a test alert in your Grafana instance and in-case you are in your support hours (check ilert.tf for this, default is Europe/Berlin Mo-Fr 8am-5pm) you should receive a phone call with your incident information on the provided number.
Reverting all changes
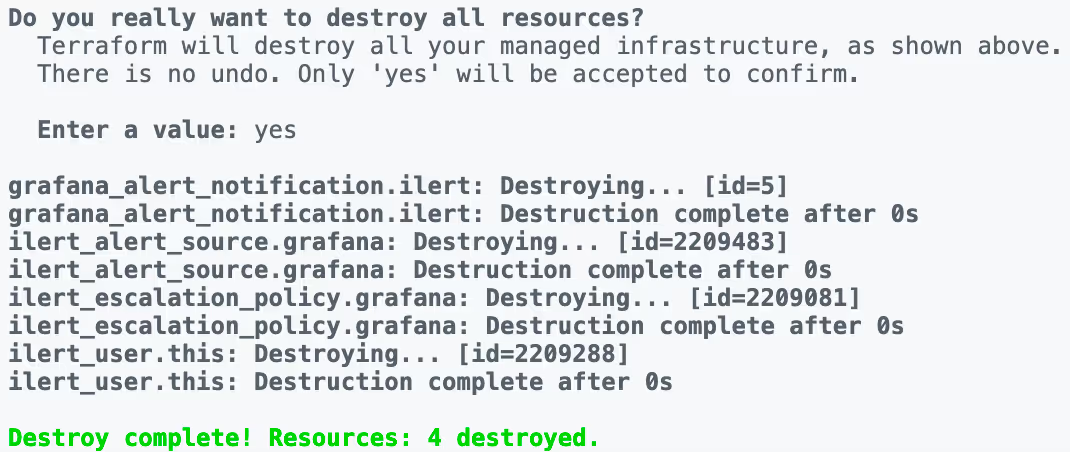
This actually illustrates the greatness of infrastructure as a code, especially during early stage environment prototyping. With a single command, we can remove all resources and start clean.
All by running terraform destroy, your cli output should look like this:

Taking this further
The ilert Terraform Provider offers more resources e.g. Connections or Connectorst that can be managed as well.
Additionally you should always ensure that the Terraform project “state” is stored in an encrypted bucket, currently the state is stored locally with your project (dropped by .gitignore). However the state contains credentials and locks, the later should be hosted in the cloud to provide shared functionallity across teams - take a look at the official docs on Terraform State for more information.


.avif)


