ilert seamlessly connects with your tools using our pre-built integrations or via email. ilert integrates with monitoring, ticketing, chat, and collaboration tools.
See how industry leaders achieve 99.9% uptime with ilert
Organizations worldwide trust ilert to streamline incident management, enhance reliability, and minimize downtime. Read what our customers have to say about their experience with our platform.
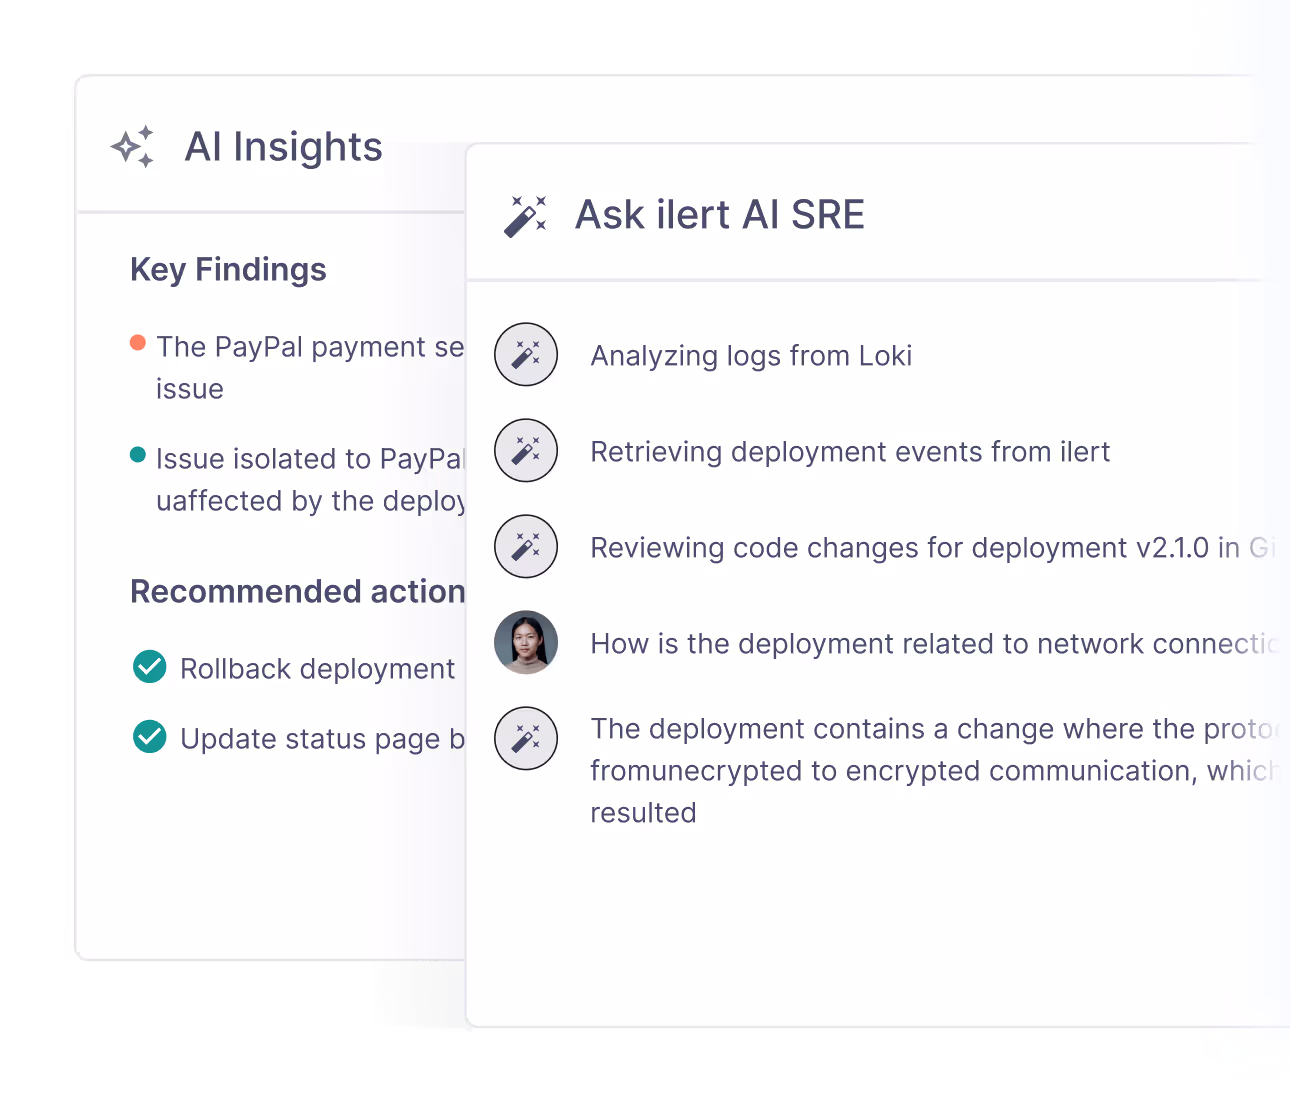
It’s 2:47 a.m. A P1 alert fires. The on-call engineer opens ilert, sees the AI has already investigated, and is presented with three remediation options. What happens next is the moment we obsessed over.
Most AI tooling at that moment hands the engineer a numbered list in a chat window and waits. The engineer reads, selects mentally, types a reply, and the agent resumes. That sequence takes seconds under pressure, but it also introduces ambiguity, re-reading, and cognitive overhead at exactly the wrong moment.
We’re building an SRE Agent, an AI agent embedded directly inside ilert’s incident response platform to handle everything from RCA and triage to on-call queries and object creation. As we made agents a first-class part of the product, one question kept coming up: what’s the right interface for a human approving an AI decision during an active incident?
Chat is the obvious default. But it’s not always the right one.
Does the agent run as a sidecar? An overlay? Is there a dedicated place to talk to it? Is chat the only interface?
Chat has one strong argument going for it: the agent can be wherever the user is: Slack, WhatsApp, Teams. Whenever it needs input, it reaches you on your preferred channel.
But chat also has real drawbacks. In many cases, it’s still too much input. Users don’t always know what to type or where to start. And when you push the interaction into a chat channel, you’re limited to what that channel supports, which usually means text.
Here’s how we’re approaching it at ilert:
The bet is that the best agent UX won’t feel like a chatbot. It’ll feel like the product got smarter. ActionOption Cards are where that thinking gets concrete, and they start by solving one very specific piece of friction.
The problem with plain-text option lists
Back to 2:47 a.m. The AI has already done the hard part: correlated signals across Datadog and GitHub, identified a bad deploy, and narrowed the options to three. That work matters. What happens next can undo it.
Most AI tooling hands the engineer a numbered list in a chat box and waits. That forces them to read, mentally select, and type a confirmation back, friction at exactly the wrong moment, and ambiguity that the agent then has to resolve. The pattern looks like this:
1. Scale up the payment-gateway deployment
2. Restart the affected pods
3. Roll back to the previous version
This forces the user to read the option, mentally select it, and type a follow-up message to confirm their intent. That is friction at exactly the wrong moment. It also introduces ambiguity, did the user mean option 1 exactly, or a variation of it?
The interface should be decisional, not just conversational. During an active incident, engineers operate under cognitive load. Every second spent re-reading, re-parsing, or re-typing is a second the incident continues.
What are A2UI (agent-to-user interface) ActionOption cards?
We are using the A2UI framework for dynamically rendering interactive UI elements inside the agent conversation thread, components that the agent generates on the fly, not static screens. An ActionOption Card is the primary way it is expressed: it’s what the agent renders instead of a numbered text list whenever a user action is required.
Each card represents a single, discrete course of action and is composed of:
Title: A short, unambiguous label for the action, e.g. “Option 1: Scale up payment-gateway”.
Description: An explanation of what the action does and the trade-offs it involves, so engineers can make an informed decision at a glance.
Tag badge (optional): A colour-coded label: Recommended (green), Immediate (amber), Quick (blue), or Best (green). Only rendered when it meaningfully differentiates an option.
Action button: A clickable button with a short action verb and an optional icon. One click is all that’s required to proceed.
A simple example: the agent proposes three options. Instead of typing “1”, “2”, or “3”, you click a button. This pattern scales into more complex scenarios: selections, sliders, rich tables.
Technical architecture: How cards are generated and rendered
Three things make it work: the LLM, a thin tool layer, and the frontend.
Step 1: Tool call
We built a dedicated tool that the agent can call whenever it decides structured options make more sense than a plain text reply. The LLM passes a list of option objects, one per card:
{
  "options": [
    {
      "title": "Scale up payment-gateway",
      "description": "Increase replica count from 3 to 6 to absorb current traffic spike. No downtime expected.",
      "tag": "Recommended",
      "risk": "low",
      "effort": "~2 min",
      "actionLabel": "Scale up"
    },
    {
      "title": "Option 2: Roll back to v2.4.1",
      "description": "Revert the deployment to the last stable version. Resolves regression but requires redeployment.",
      "tag": "Immediate",
      "risk": "medium",
      "effort": "~10 min",
      "actionLabel": "Roll back"
    }
  ]
}
Step 2: Rendering
For each option, a unique identifier is generated. An A2UI surface update command is then published to the backend message bus. The frontend subscribes to these events and renders the cards in real time within the conversation thread as they arrive, no page reload, no manual polling.
Step 3: User interaction and intent injection
When the engineer clicks an action button, an event carrying the option's unique identifier is sent back to the agent. The agent maps this to a pre-configured confirmation sentence, for example, "Yes, scale up the payment-gateway replicas", and injects it into the chat thread as if the user had typed it themselves. This seamlessly resumes the LLM loop with the user's confirmed, unambiguous intent.
Step 4: Post-selection state
Once the engineer clicks, the card updates its own state: the action button is replaced with a green checkmark labelled "Selected". This visual confirmation makes it clear the action has been acknowledged and prevents accidental double submissions.
Why this pattern matters
This is ilert’s answer to a question every AI SRE vendor is navigating: how much should the agent do autonomously, and when does it hand back to a human? Our answer is that the handoff moment needs to be as frictionless as the investigation that precedes it. ActionOption Cards are built for that moment. Here’s what that means in practice:
Visual scannability. Cards are spatially separated, visually distinct, and carry structured metadata. An engineer can evaluate three options at a glance rather than reading a paragraph of text.
Explicit risk and effort signalling. Rather than leaving the risk assessment to intuition, the agent surfaces risk and effort data directly alongside each option, information drawn from runbooks, historical incident data, or its own analysis.
Unambiguous intent. A clicked button maps to an exact, machine-readable action. There is no natural language ambiguity between “scale it up” and “increase the replicas”. The identifier-to-sentence mapping ensures the LLM receives exactly the intent the engineer confirmed.
Resumable agent loop. Because the injected confirmation sentence re-enters the chat thread like any other user message, the LLM loop resumes without special-case handling. The agent continues its workflow as if the engineer had typed the response naturally.
The click is the governance
A lot of AI SRE products talk about human-in-the-loop as a safety concept. ActionOption Cards make it a UX reality. The engineer doesn’t approve an action by typing “yes” into a chat box, they click a button that surfaces the risk, the effort, and the trade-off at a glance. The approval is informed and it’s fast.
That’s the difference between an AI agent bolted on top of a product and one that’s built into it. The agent earns autonomy gradually, and at every step, the human approval moment is designed to be as clear and fast as the AI investigation that preceded it.
Back to 2:47 a.m. The AI investigated. Three options are on screen. One click.
An incident response platform helps organizations manage, track, and resolve IT incidents quickly and efficiently. With the right platform, teams can minimize downtime, reduce the impact of incidents, and lower their Mean Time to Resolution (MTTR).
In this article, we’ll explore the top 5 incident response platforms for 2026, helping you choose the best solution for your needs.
This list is slightly biased, after all, we do offer a full end-to-end incident management platform ourselves. That said, we’ve made every effort to keep things fair. The platforms we’ve included are trusted, robust, and capable of handling all your operational needs. We’ve also broken down their similarities and differences to help you navigate the landscape and find the right fit, even if it’s not us.
Key Takeaways
Selecting an incident management tool is critical for effective incident management, especially for companies navigating EU regulations and recent industry changes like OpsGenie’s EOL.
Key features to look for in incident response and management include multi-channel alerting, automated workflows, customizable escalation policies, and robust integrations with existing systems.
Leading platforms offer advanced functionalities tailored for various organizational needs but can vary significantly in cost and suitability for different team sizes.
Key Features of Leading Incident Response Platforms
When evaluating platforms in 2026, several core features stand out as essential for engineering and operations teams. Let's start with alerting features. First and foremost, alerting must be multi-channel: supporting voice calls, SMS, push, email, and chat tools like Slack, Microsoft Teams or Google Chat, and fully actionable without requiring the user to log in or switch apps. Time-to-response is critical, and eliminating friction at this step can mean the difference between a minor service disruption and a major outage. Advanced capabilities such as alert deduplication, intelligent grouping, noise reduction through filtering rules, and reusable templates help reduce alert fatigue, ensuring that responders only receive relevant and high-priority signals. In recent years, many incident response platforms have also introduced AI-driven capabilities that automatically correlate alerts, surface related signals, and suggest potential root causes, helping teams reduce mean time to resolution (MTTR). Some platforms can analyze logs, metrics, and recent code or deployment changes to investigate incidents in real time, recommend remediation steps such as service restarts or rollbacks, and generate structured post-incident summaries for faster learning and continuous improvement.
Another critical component is on-call management. Platforms should offer automated on-call scheduling with support for rotations, overrides, and hand-offs, as well as fully customizable escalation policies, ensuring the right person is notified based on severity, time of day, or other dynamic conditions. It's also important that the UI is convenient and easy to use for all members of on-call teams.
Integration capabilities are key for embedding the incident response process into your existing tooling. Leading platforms offer native integrations with monitoring and observability tools (like Prometheus, Datadog, or PRTG), log aggregators (such as Loki), ITSM tools (e.g., ServiceNow, Jira Service Management), and CI/CD systems (like GitHub or GitLab). These integrations ensure seamless data flow and enable fast context gathering during incidents.
Status pages are another valuable asset. They allow teams to communicate transparently with users and stakeholders during outages, reducing support load and building trust.
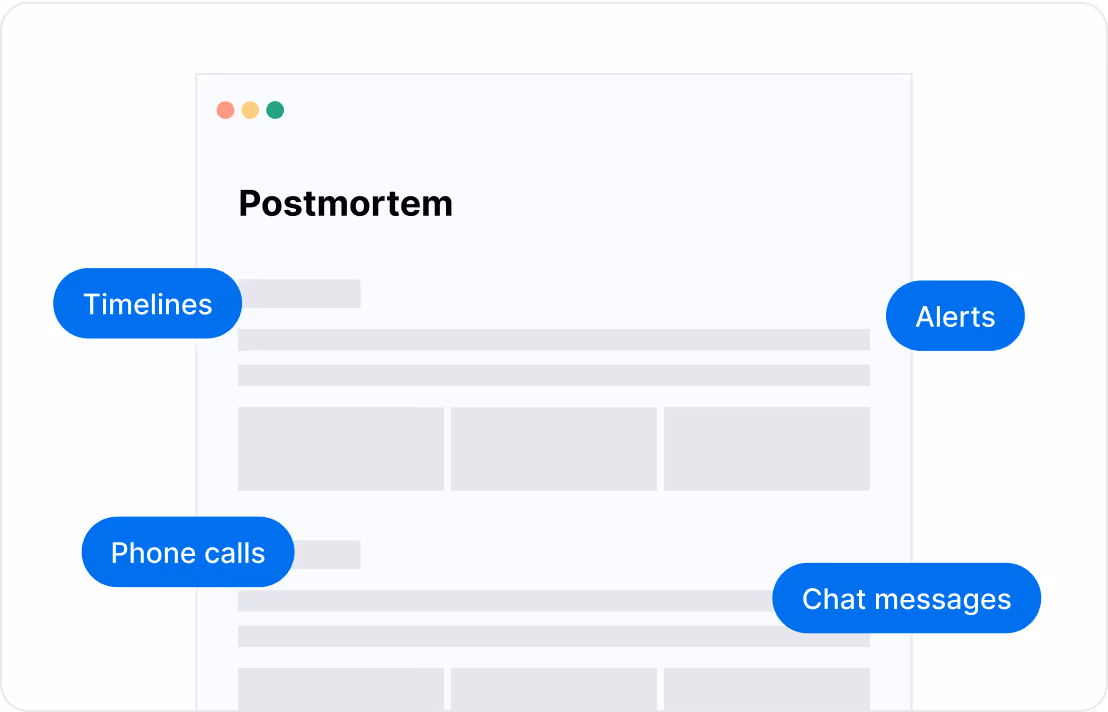
Finally, post-incident analysis is no longer a nice-to-have. Platforms should support automated postmortem creation by capturing timelines, chat logs, alerts, and resolution steps. This not only reduces administrative overhead but also enables teams to focus on root cause analysis, lessons learned, and continuous improvement.
In short, a modern incident management platform should act as a control center—tightly connected with your stack, automating where it can, and enabling humans to focus on the decisions that matter most.
ilert: A European powerhouse for end-to-end incident management
ilert is a cross-stack incident response platform designed for modern DevOps and SRE teams. It connects alerts, observability signals, deployments, and infrastructure data across your technology stack so AI can investigate incidents with full context and coordinate response actions in one unified environment. As an AI-first platform, ilert is designed around a simple north star: you only get paged when the AI can't safely proceed.
At the core is the ilert AI SRE; an intelligent agent that investigates every alert. It analyzes logs, metrics, and recent changes across your observability stack, identifies root causes and similar past incidents, and proposes remediation paths for human approval or resolves incidents autonomously when confidence is high. A governance model moves progressively from read-only to supervised to autonomous, with full audit trails, team-scoped agents, and human-in-the-loop controls at every stage.
AI capabilities span the full incident lifecycle; from scheduling to resolution. Intelligent alerting handles noise through AI-powered deduplication, dynamic grouping, and smart routing, with acknowledgment via push, SMS, voice, and chat. The on-call scheduler manages rotations, overrides, and escalation policies across UI, API, and mobile. The AI Voice Agent takes the first call, gathers context, and escalates only when needed. ChatOps integration keeps response orchestrated from Slack, Microsoft Teams or Google Chat. Natively integrated status pages automate stakeholder communication in real time. And AI-generated postmortems turn incident timelines into structured, actionable reports, automatically.
ilert connects to your existing stack via 100+ pre-built integrations with monitoring, ticketing, ChatOps, and infrastructure tools, including Prometheus, Grafana, Datadog, Zabbix, AWS CloudWatch, Jira, ServiceNow, Slack, Microsoft Teams and Google Chat, with no migration required.
As a Germany-based company, ilert is GDPR-compliant with EU data residency and ISO 27001 certified, making it the default choice for privacy-conscious organizations. It's a more agile, customer-centric alternative to PagerDuty and Opsgenie, trusted by enterprises like REWE digital, Lufthansa Systems, Adesso, and Bertelsmann and supports use cases from DevOps and SecOps to MSPs and industrial operations.
PagerDuty: A Veteran in incident management
PagerDuty has long been considered a pioneer in the incident management space. Founded in 2009, the platform has evolved into a comprehensive solution tailored primarily for DevOps and SRE teams in large, complex environments. It offers a mature feature set that includes multi-channel alerting, on-call management, escalation policies, and real-time incident tracking.
One of PagerDuty’s strengths lies in its extensive integration ecosystem, supporting hundreds of tools such as Datadog, New Relic, AWS CloudWatch, Splunk, and more. It also features event intelligence, using machine learning to automatically suppress noise, correlate related alerts, and prioritize incidents, helping reduce alert fatigue and focus teams on what matters most.
For larger enterprises, PagerDuty offers Runbook Automation, Service Graphs, and Business Impact Metrics, making it easier to manage dependencies, assess incident impact, and align technical operations with business priorities.
However, this depth and breadth come with trade-offs. Many teams, especially those in mid-sized companies or with simpler needs, report that PagerDuty can feel overly complex and rigid, with a steep learning curve and a pricing model that quickly scales with team size and advanced feature usage.
In short, PagerDuty remains a robust and trusted platform, especially for large enterprises with advanced automation and integration needs. But for teams seeking a more agile, cost-effective, and privacy-compliant solution, particularly in Europe, there are now modern alternatives better suited to evolving operational demands.
xMatters is an established player in the incident management space, with a strong focus on workflow automation and event-driven orchestration. Designed to support DevOps, ITOps, and business continuity teams, xMatters enables organizations to build custom workflows that connect monitoring systems, notification channels, ticketing tools, and more — all through a low-code interface.
Its incident response capabilities include multi-channel alerting, on-call scheduling, escalations, and automated response actions. What sets xMatters apart is its ability to let users define automated workflows that trigger based on specific conditions.
However, xMatters can feel more focused on process automation than on hands-on, engineer-friendly incident resolution. Teams looking for an intuitive UI and tight integration with modern DevOps workflows may find it less direct than alternatives like ilert or PagerDuty. Additionally, its user interface and setup process can be perceived as complex, especially for smaller teams or those without dedicated tooling engineers.
While xMatters is a solid choice for organizations that prioritize event orchestration and workflow design, it may be overkill for teams simply looking for fast, effective incident alerting and response. That said, for enterprises with sophisticated ITSM needs and a strong focus on process automation, xMatters remains a powerful and highly customizable platform.
Grafana IRM: Unified incident response for Grafana ecosystem
Grafana IRM (Incident Response & Management) is the new, integrated incident management solution from Grafana Labs, combining the capabilities of Grafana OnCall and Grafana Incident into a single, cloud-based platform. Built natively into the Grafana Cloud ecosystem, Grafana IRM aims to simplify the entire incident lifecycle: from detection to resolution, for teams already using Grafana for observability.
One of the key advantages of Grafana IRM is its seamless integration with Grafana Cloud monitoring tools like Loki, Tempo, and Prometheus. Teams can create, track, and resolve incidents directly from their dashboards without needing to jump between multiple systems. The platform includes built-in on-call scheduling, automated escalations, and incident tracking, all accessible from a unified interface. It also supports customizable workflows, helping teams define how alerts are routed, how incidents are escalated, and how post-incident reviews are handled — all while keeping stakeholders in the loop via native notifications.
For teams already invested in Grafana Cloud, IRM offers convenience and speed. It reduces tool sprawl, lowers onboarding complexity, and keeps incident response tightly aligned with monitoring and logging. However, the platform may not be ideal for teams with hybrid or diverse monitoring stacks outside of Grafana Cloud, as it is tightly coupled to the Grafana ecosystem. Additionally, some advanced enterprise-grade features — such as AI-based alert deduplication, voice-based incident routing, or multi-tenant support — are better covered by dedicated platforms like ilert or PagerDuty.
Overall, Grafana IRM is a solid and integrated option for Grafana Cloud users seeking a native, streamlined incident response experience—but it may serve best as a complement or starting point rather than a fully standalone platform for complex or non-Grafana environments.
OpsGenie: solution for Jira Service Management users
Opsgenie, once a go-to solution for incident alerting and on-call management, has long been part of the Atlassian ecosystem. Known for its clean interface, solid alert routing logic, and tight integration with Jira and Confluence, Opsgenie served many DevOps and IT teams well—especially those already invested in Atlassian products.
The platform offered core features like on-call scheduling, multi-channel alerting, escalation policies, and integrations with popular monitoring tools such as Datadog and Prometheus. Its alert customization and incident timeline features made it a practical choice for managing critical events, with support for collaboration tools like Slack.
However, Opsgenie will be phased out and merged into Atlassian’s broader ITSM suite, primarily Jira Service Management (JSM). This shift has introduced challenges for teams that relied on Opsgenie as a standalone, lightweight incident response tool. The tighter coupling with JSM increases complexity and may not suit agile DevOps teams or service providers seeking flexibility and speed.
Atlassian stopped selling new standalone Opsgenie subscriptions in June 2025 and plans to fully discontinue support by April 2027, encouraging organizations to migrate to Jira Service Management or alternative incident management platforms.
As a result, many organizations are now actively searching for an Opsgenie alternative—one that delivers the same reliability with more responsive support, a dedicated roadmap, and deeper flexibility. Platforms like ilert have emerged as top choices, offering seamless migration paths, GDPR compliance, and advanced alerting, scheduling, and automation capabilities that go beyond what Opsgenie provided. Meanwhile, if you are using JSM and plan to continue doing so, Opsgenie is still a great solution that will soon merge into the familiar platform.
Looking for an Opsgenie alternative? See how switching to ilert works and receive full migration support from our Customer Success team.
Summary
Choosing the right incident response platform is crucial for maintaining service reliability and ensuring quick resolutions to incidents. Each of the platforms reviewed in this blog post offers unique strengths and features, making them suitable for various organizational needs.
From a redesigned status page to smarter event flows and broader ChatOps support, here's everything that's shipped across this quarter.
Status Page
Redesigned status pages: cleaner, clearer, faster
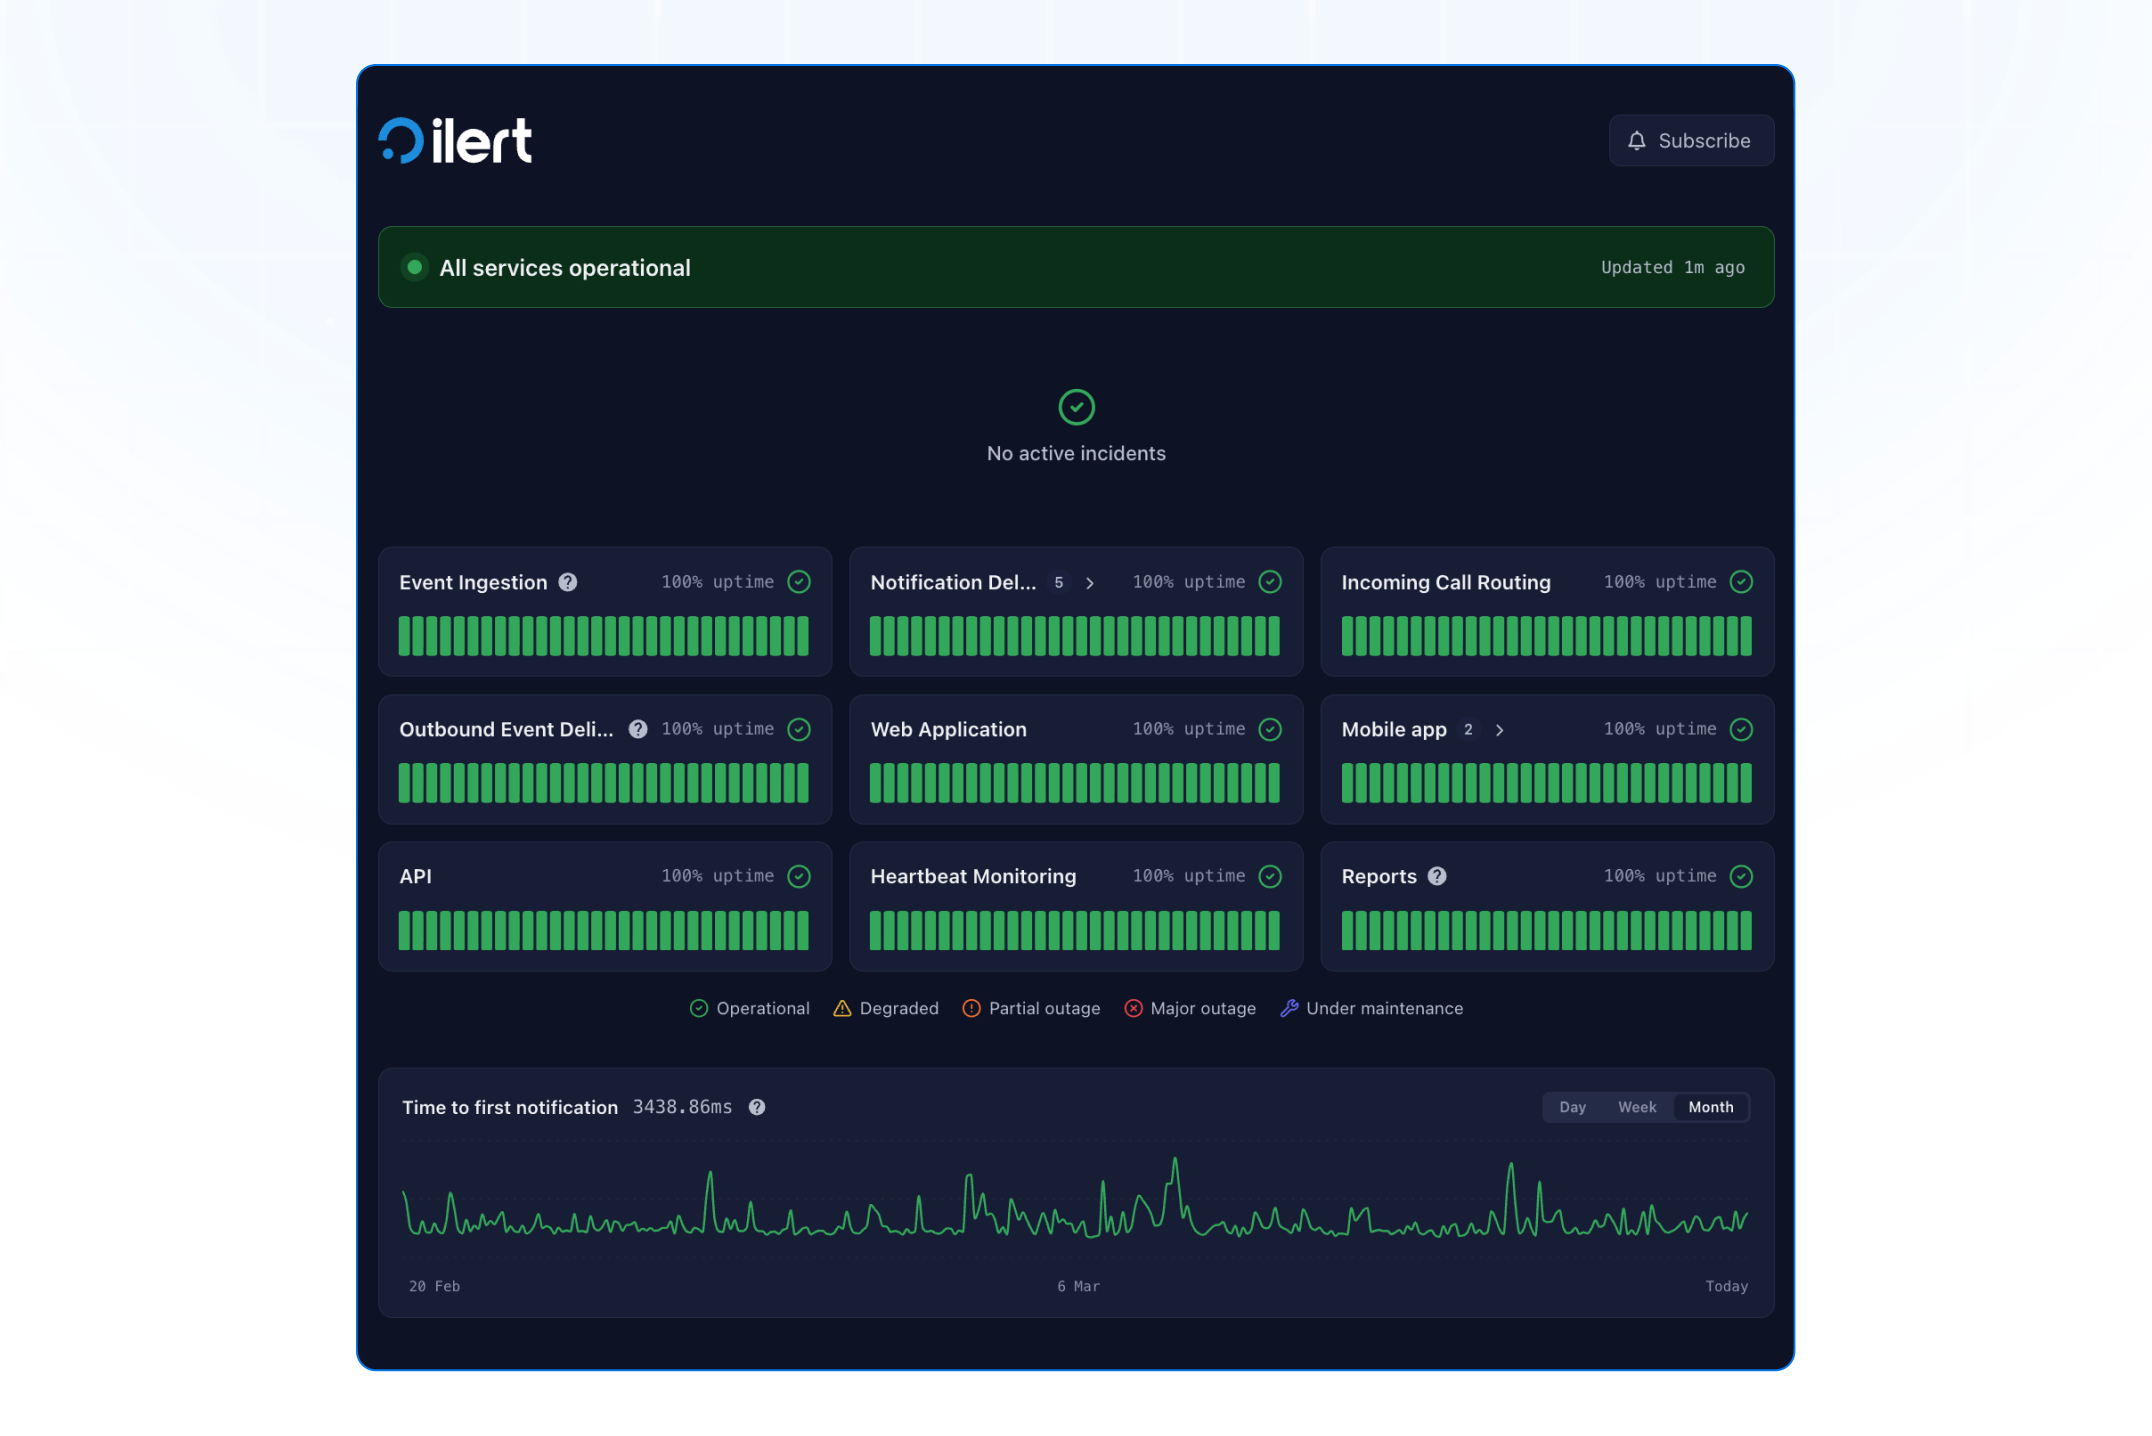
Our status pages now have an updated look and a lot more clarity.
We've redesigned ilert's public-facing status pages from the ground up: cleaner visual language, better information hierarchy, and faster access to what matters during an incident. Here's what's new:
Smarter incident cards: expandable timelines show the full update history with affected services at a glance, so your users always know exactly what's impacted and what's being done.
Clearer past incident history: incidents are now grouped by date, expandable with full timelines, and each entry links to a dedicated detail view.
Instant status at a glance: a full-width status banner with a live indicator tells visitors the current system state the moment they land on the page.
The redesign is fully responsive and built for the detail-oriented audience that checks your status page during an outage: no clutter, no ambiguity.
ChatOps
Google Chat is now supported
ilert's ChatOps has always helped teams stay in sync by letting them manage incidents without leaving their chat tool. Now, we're expanding that reach: Google Chat is officially supported alongside Slack and Microsoft Teams.
Your team can now:
Receive alerts in channels with the new Google Chat alert action
Take action on alerts: Accept, Escalate, Resolve, Reroute, Merge Into
Enjoy seamless user mapping so actions are executed on behalf of the right team member
Look up who's on call instantly, no dashboard, no tab-switching, no delay
Create a war room in seconds, so response is structured from the first minute
Whether your team works in Slack, Teams, or Google Workspace, ChatOps ensures incident management happens where your team already collaborates.
Event Flows
Transform Event node
You can now modify and enrich event properties, like priority, labels, and summaries: directly in your Event Flows using the new Transform Event node. Fully manageable via Terraform for version-controlled incident orchestration.
Transform node execution logs
You can now see exactly what happened inside a transform node during event flow execution, making it faster to debug rules and understand how events are being modified in transit.
Two new log entries are available:
Transform Error: captured when a rule fails at runtime, with a machine-readable error code, a short description, and the specific rule that caused the issue.
Transformed: emitted once after all rules are processed, only when at least one net delta exists.
Both entries are accessible directly in the execution log, giving you a clear audit trail from raw event in to transformed event out.
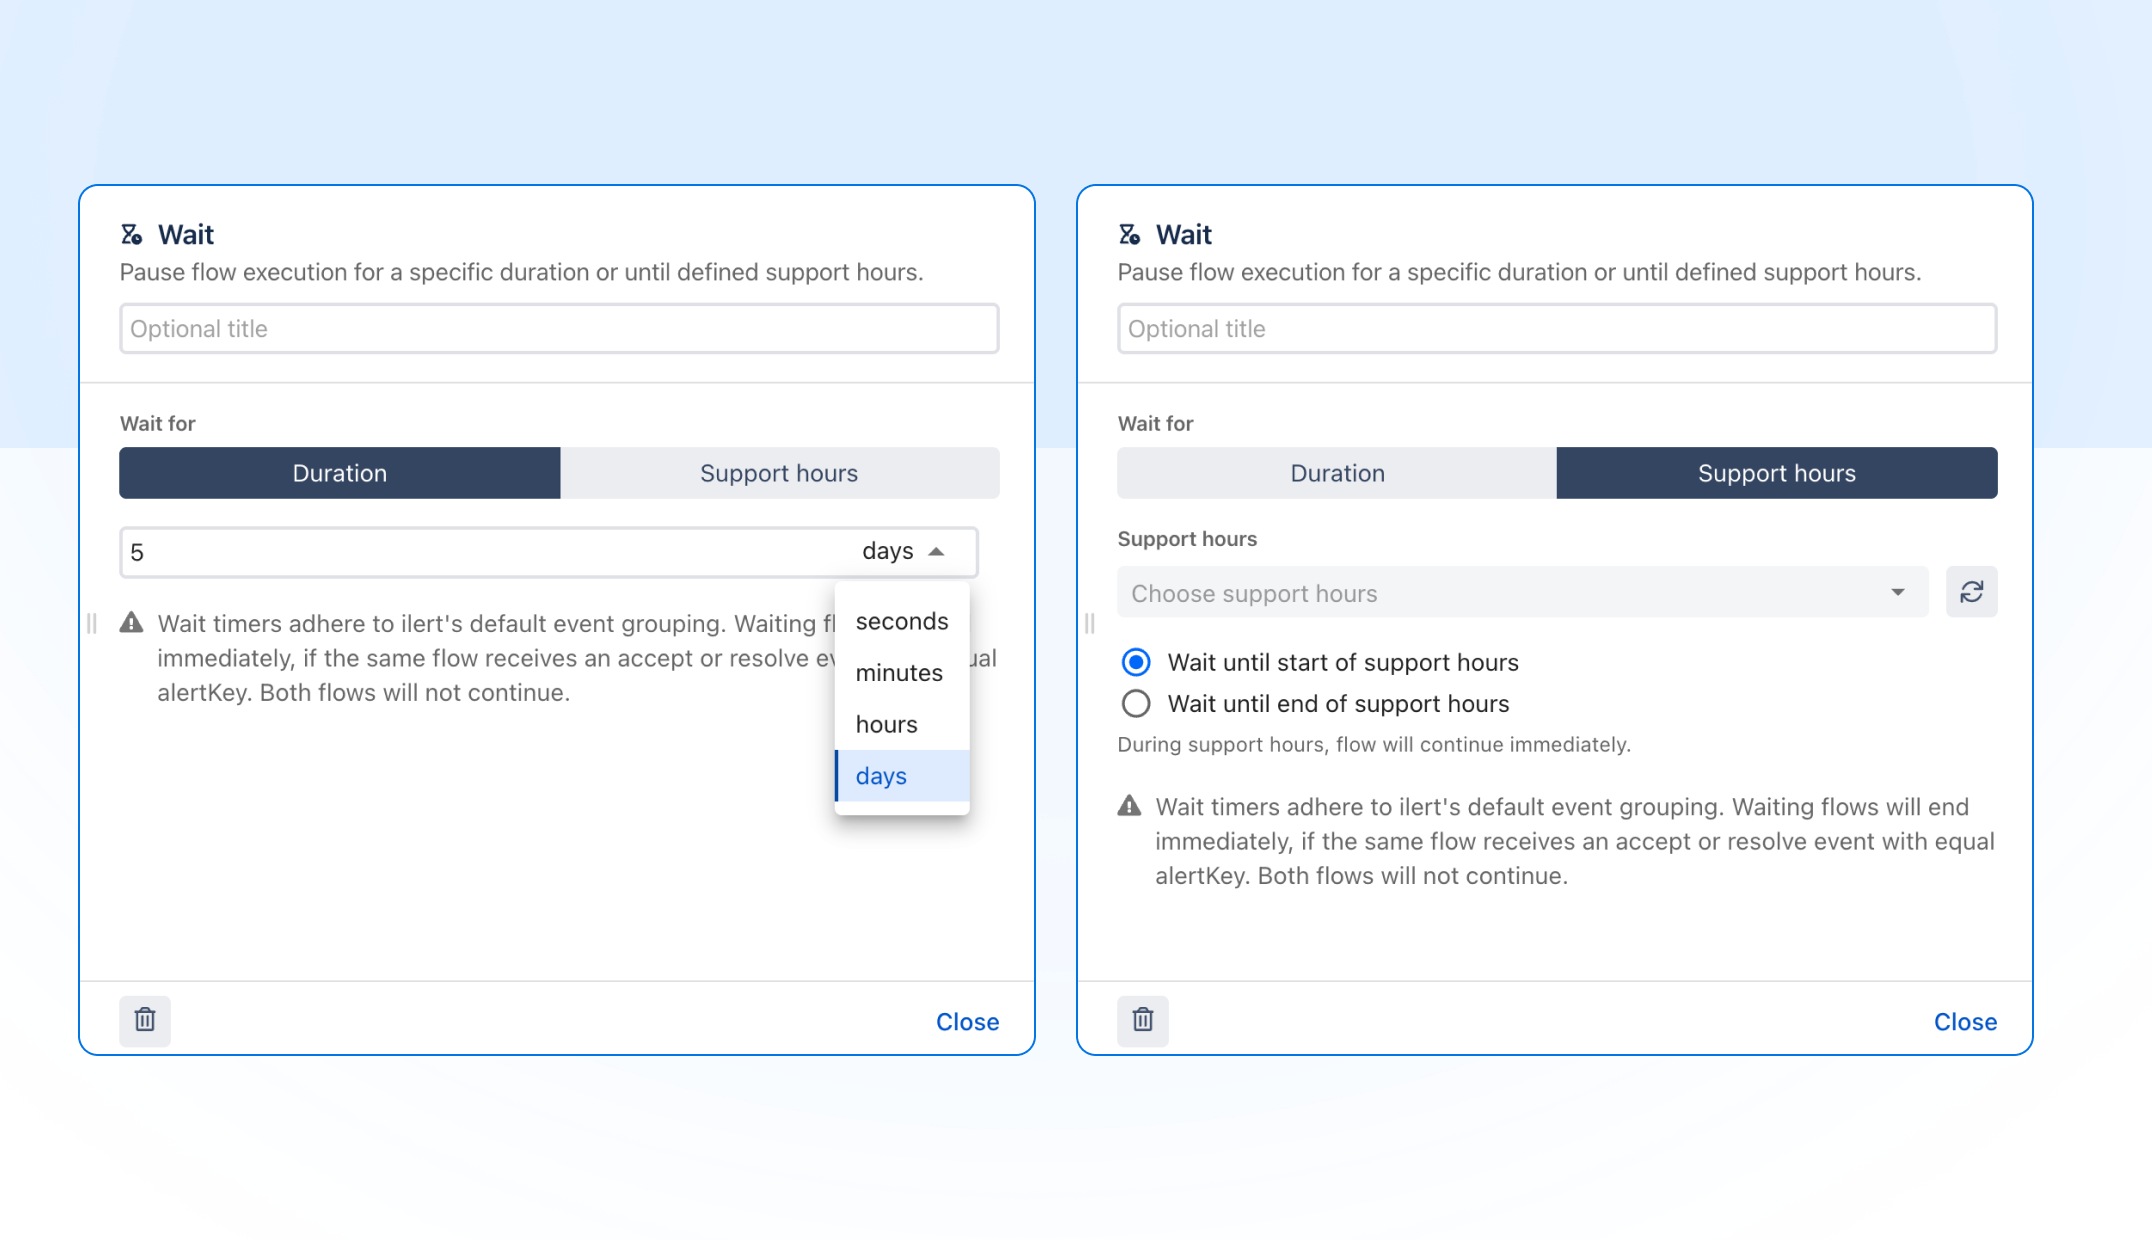
Wait nodes now support support hours and multi-day durations
Event flows can now pause and resume based on your configured support hours, so routing logic respects when your team is actually available, not just whether a condition is met. Wait durations can also now be set in days, extending the previous limit of hours.
Terraform
Export resources to Terraform: from UI to code in one click
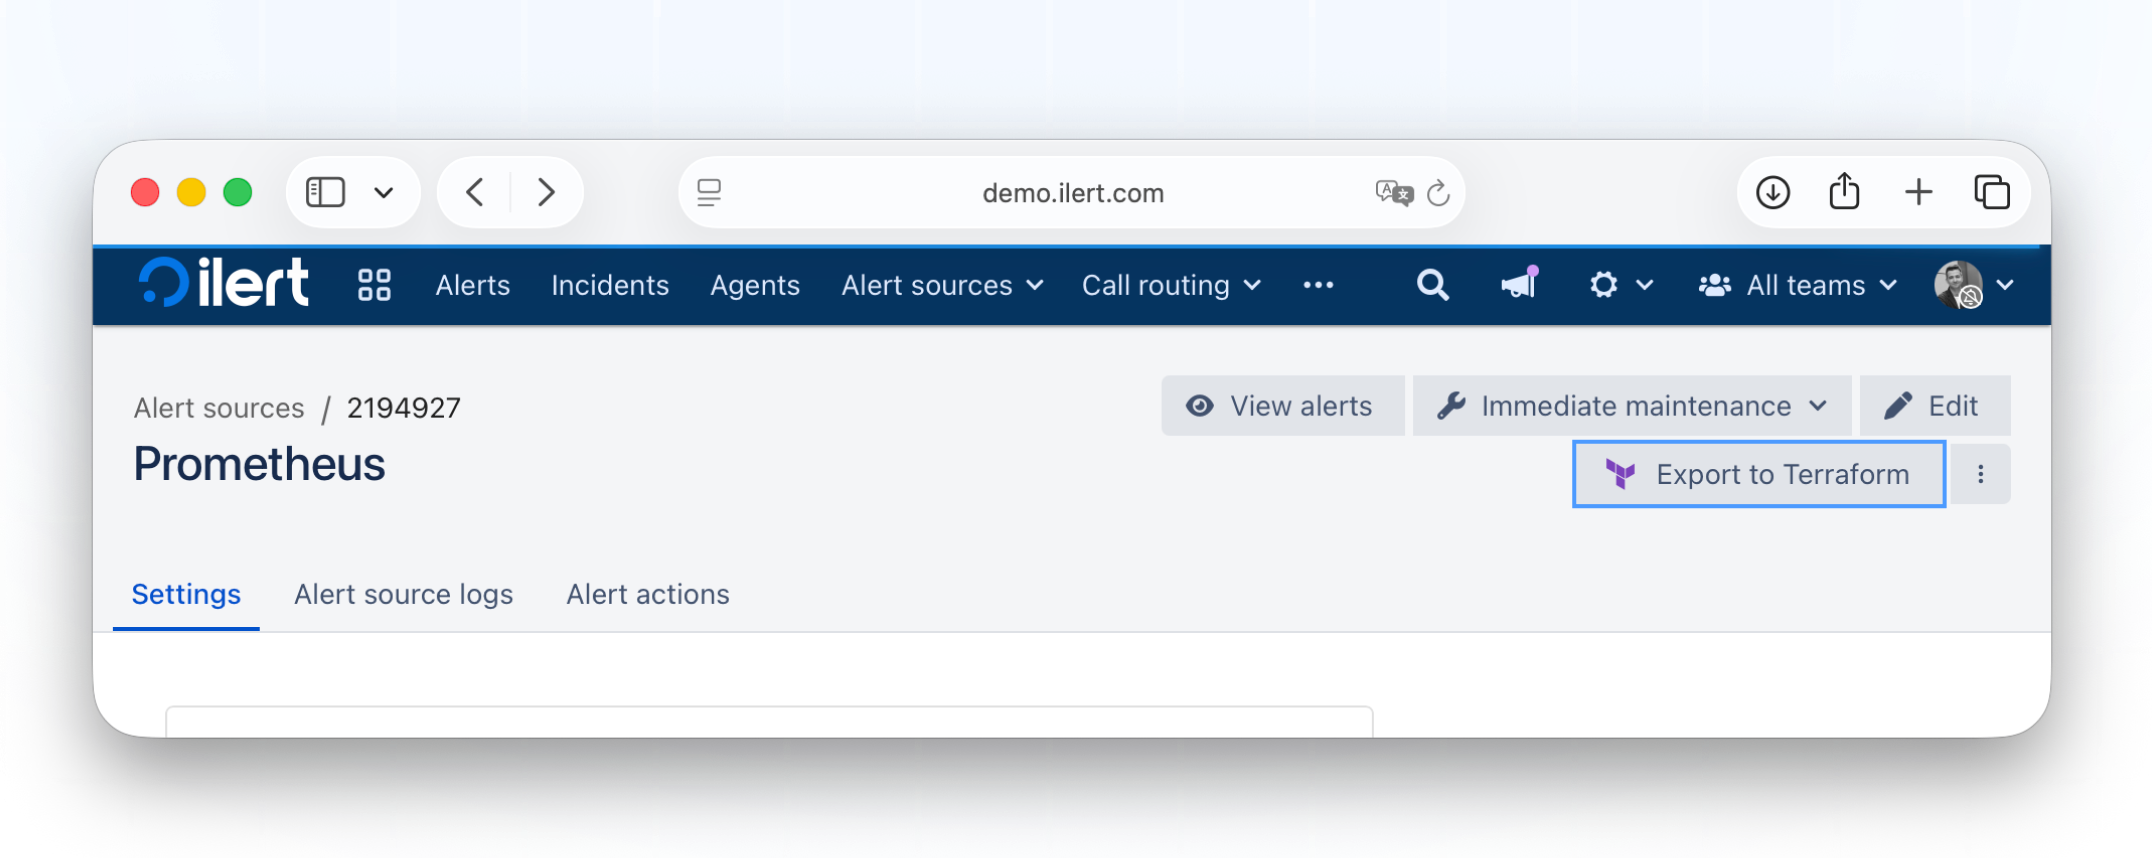
We're making Infrastructure-as-Code adoption easier. With the new Export to Terraform feature, you can generate valid HCL resource blocks directly from any resource detail page with a single click. Bridge the gap between UI and code instantly, and accelerate your IaC workflows without having to write configuration by hand.
Alerting & Incident Management
Teams in escalation policies
You can now add teams to escalation policies, in addition to individual users and schedules. This enables less configuration overhead and clearer accountability at scale.
Services and severity: end-to-end
Define default service and severity values in your Alert Source, push real-time overrides via the Event API, and view live impact levels directly in the Alert Detail view. Smart defaults with full override flexibility, visible where it matters most.
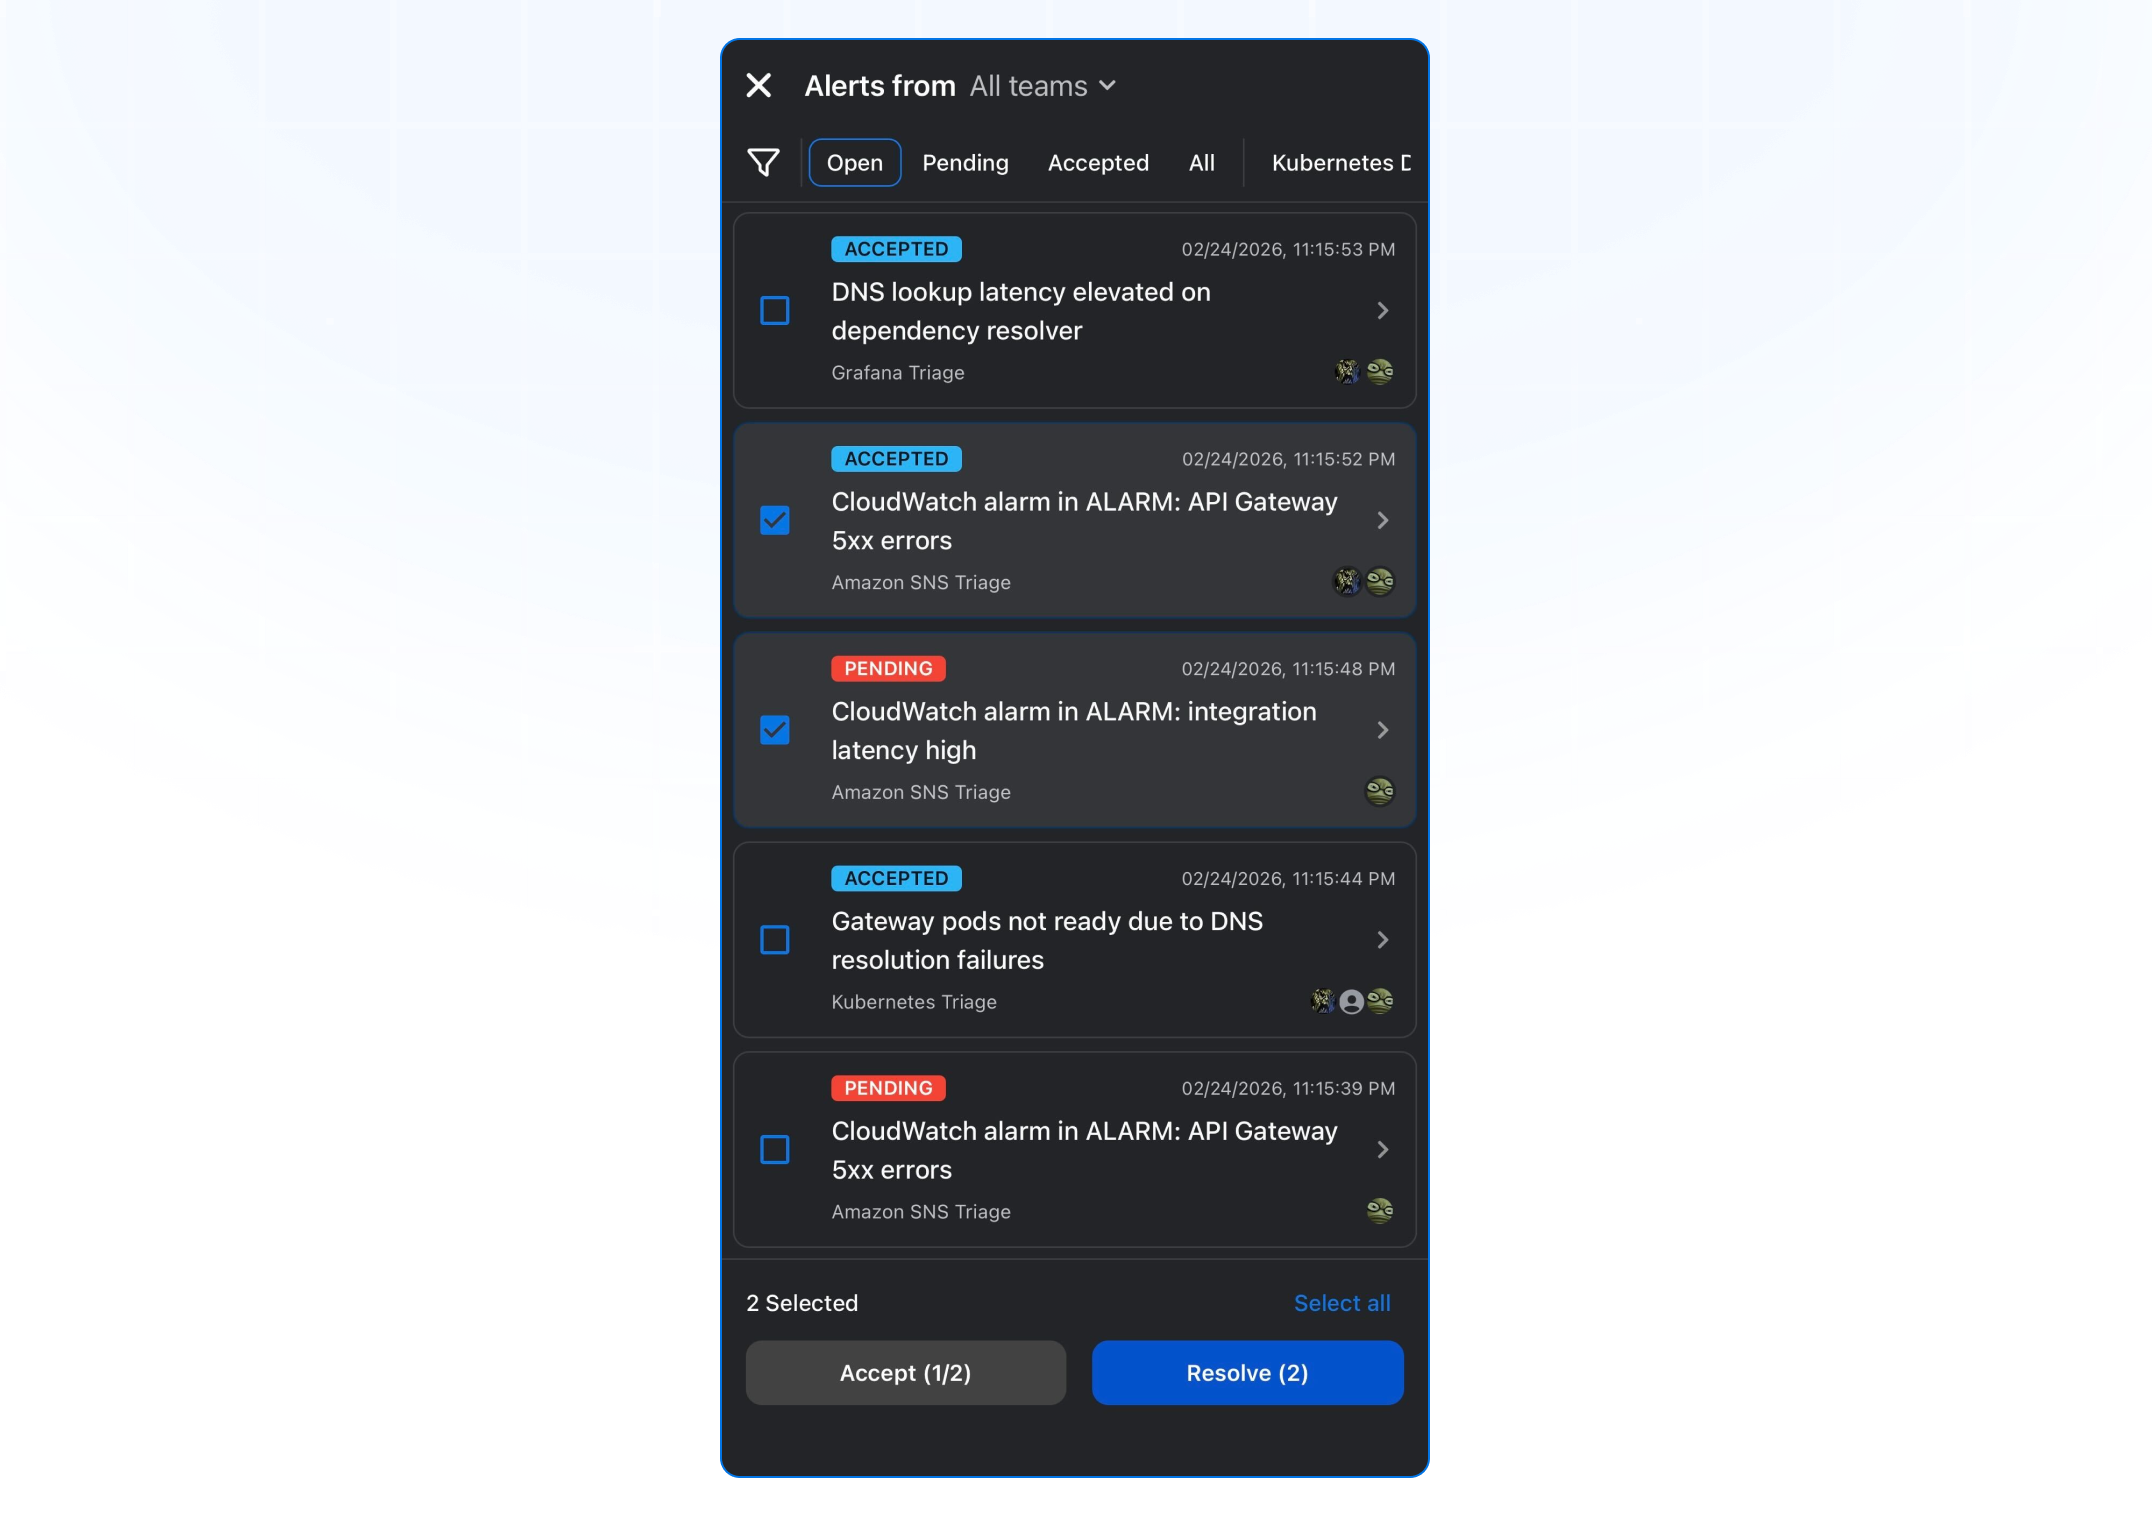
Add multiple responders at once
You can now select and add multiple responders or targets at once directly from the Alert detail view, no more adding them one by one.
Alert reports now support label filters
You can now filter alert reports by label, making it easier to scope reports to a specific service, team, or environment.
Access & Roles
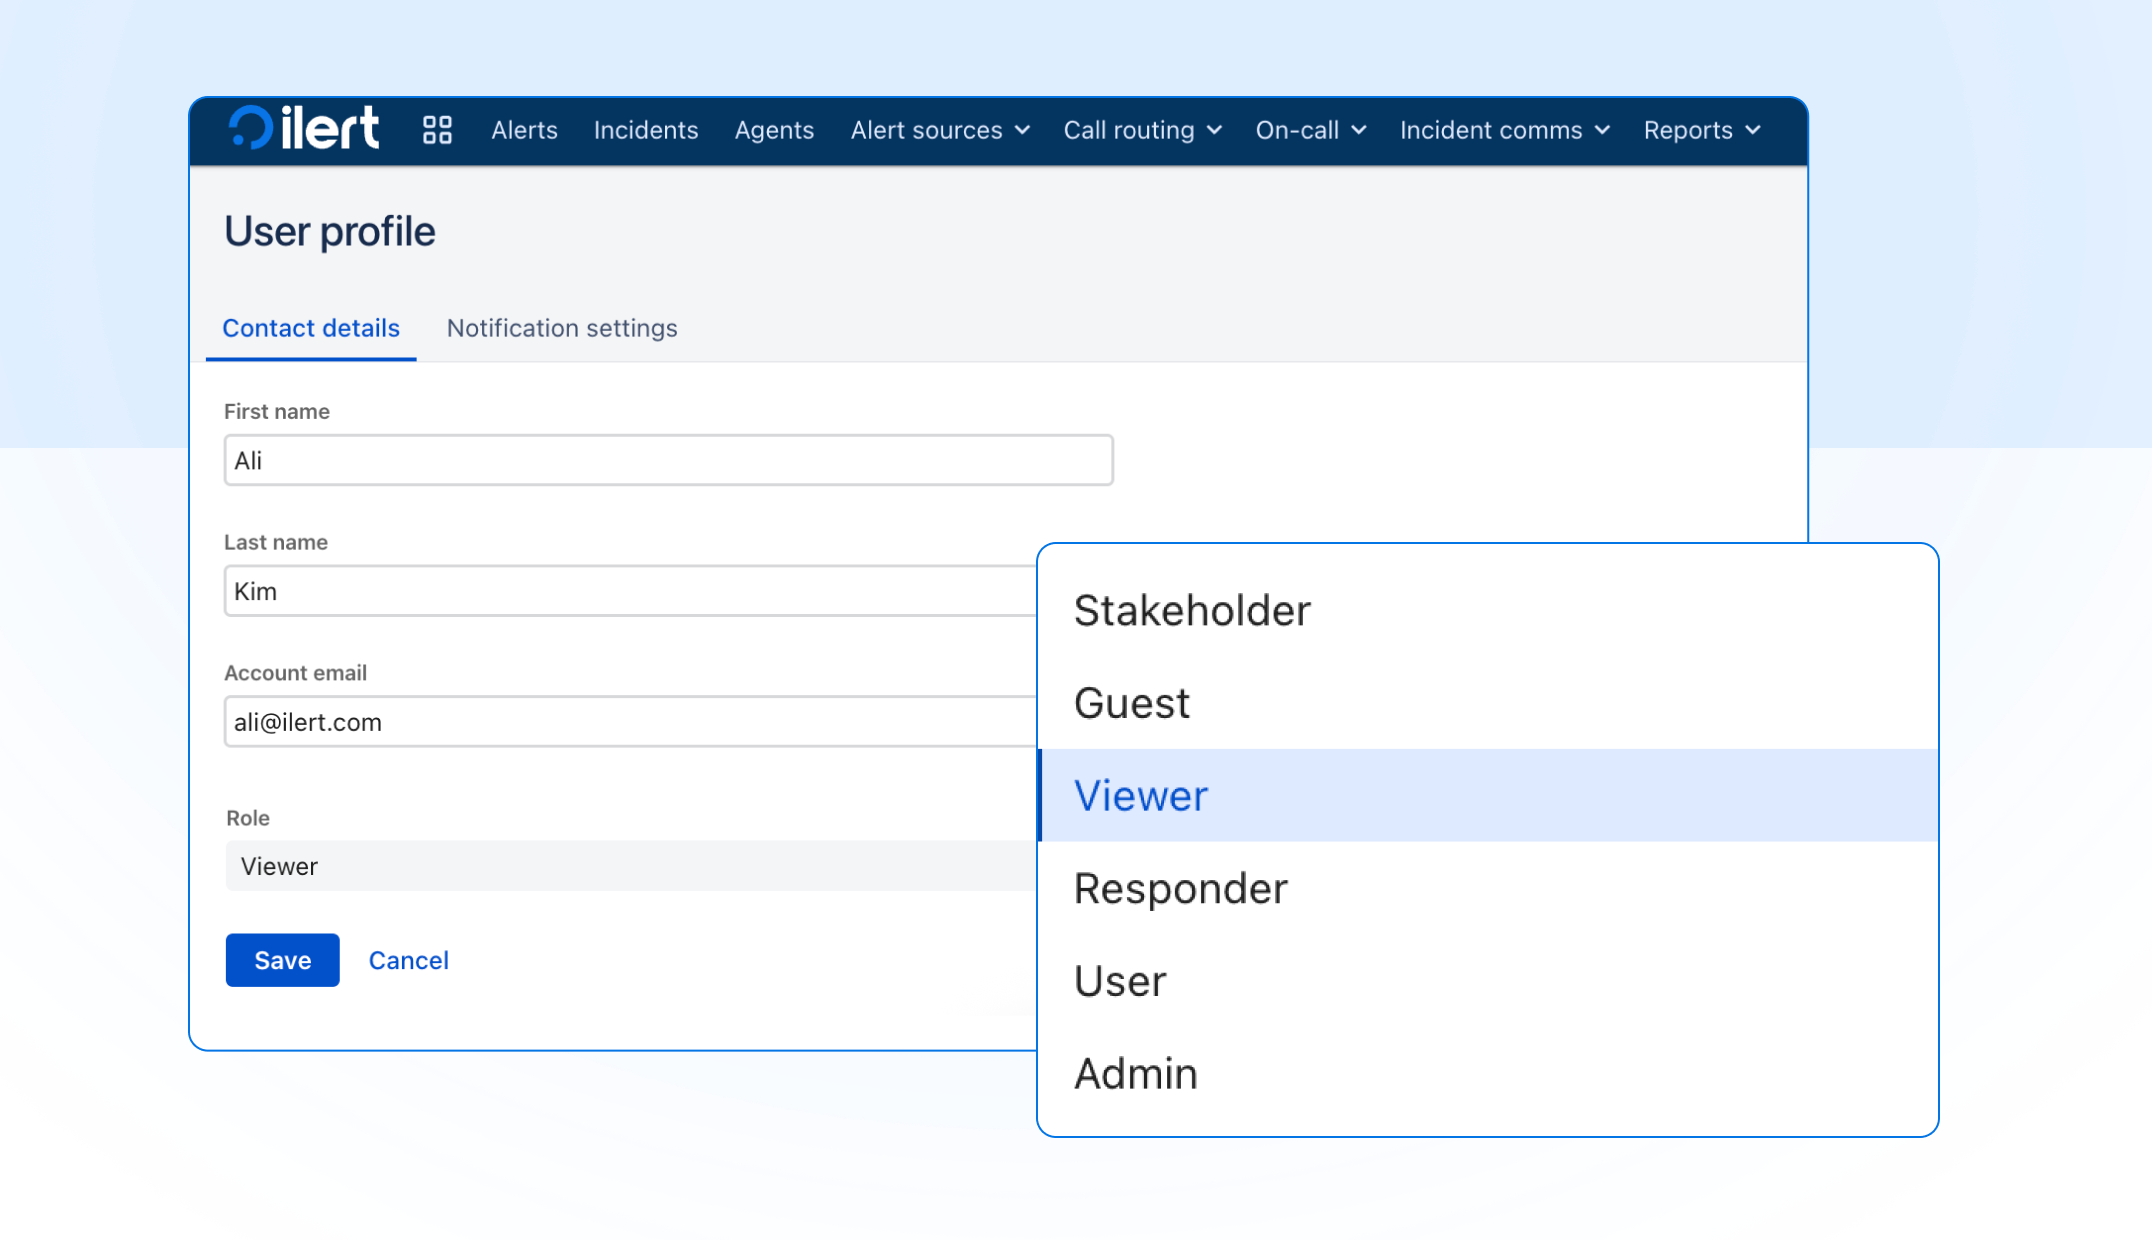
Introducing the Viewer role
Meet the new Viewer role, designed for internal users who need full operational visibility, without the risk of making changes. Viewers get account-wide, read-only access to all incidents, alerts, services, configurations (including on-call schedules, escalation policies, and alert sources), and reports.
It's ideal for engineering managers, executives, and customer support leads who need transparency and insight, while keeping operational control firmly in the right hands.
Billing
Admins can now purchase seats directly
When adding a new user would require an extra seat, ilert flags it upfront and asks for confirmation before proceeding. A dedicated setting in the account settings page (accessible by account owners) allows you to control whether admins can purchase additional seats. Additional seats are always prorated. Billing timing depends on your plan:
Invoice customers: charged on your next invoice
Self-service monthly plans: charged on your next invoice
Self-service annual plans: charged immediately
Invoice payment for self-service annual plans
Starting with German customers, we're gradually expanding invoice support to additional countries, including the EU and US. Customers on an annual subscription of €2,000 or more can pay by invoice: fully automated, no manual steps required.
Note: invoice revisions are not supported.
Call Routing
Voicemail transcriptions now support multiple languages
Call flow voicemail transcriptions are no longer limited to a single language. ilert now detects and transcribes voicemails in the language they were left in.
Mobile
Redesigned alert detail view
We've streamlined the mobile alert detail view to give you more space for what's important and make incident handling faster on the go. The alert summary, chips bar, and tabs are now organized for a cleaner layout, with the chips bar showing up to two lines by default and a label icon for better clarity. The actions bar stays fixed at the bottom, keeping key actions always within reach. Less scrolling, clearer context, quicker decisions.
Bulk acknowledge and resolve
You can now select multiple alerts and acknowledge or resolve them in one tap, directly from the alert list view on mobile.
Integrations
Custom HTTP headers for webhook alert actions
You can now define custom headers on outbound webhook integrations, useful for passing authentication tokens, API keys, or any metadata your receiving endpoint expects.
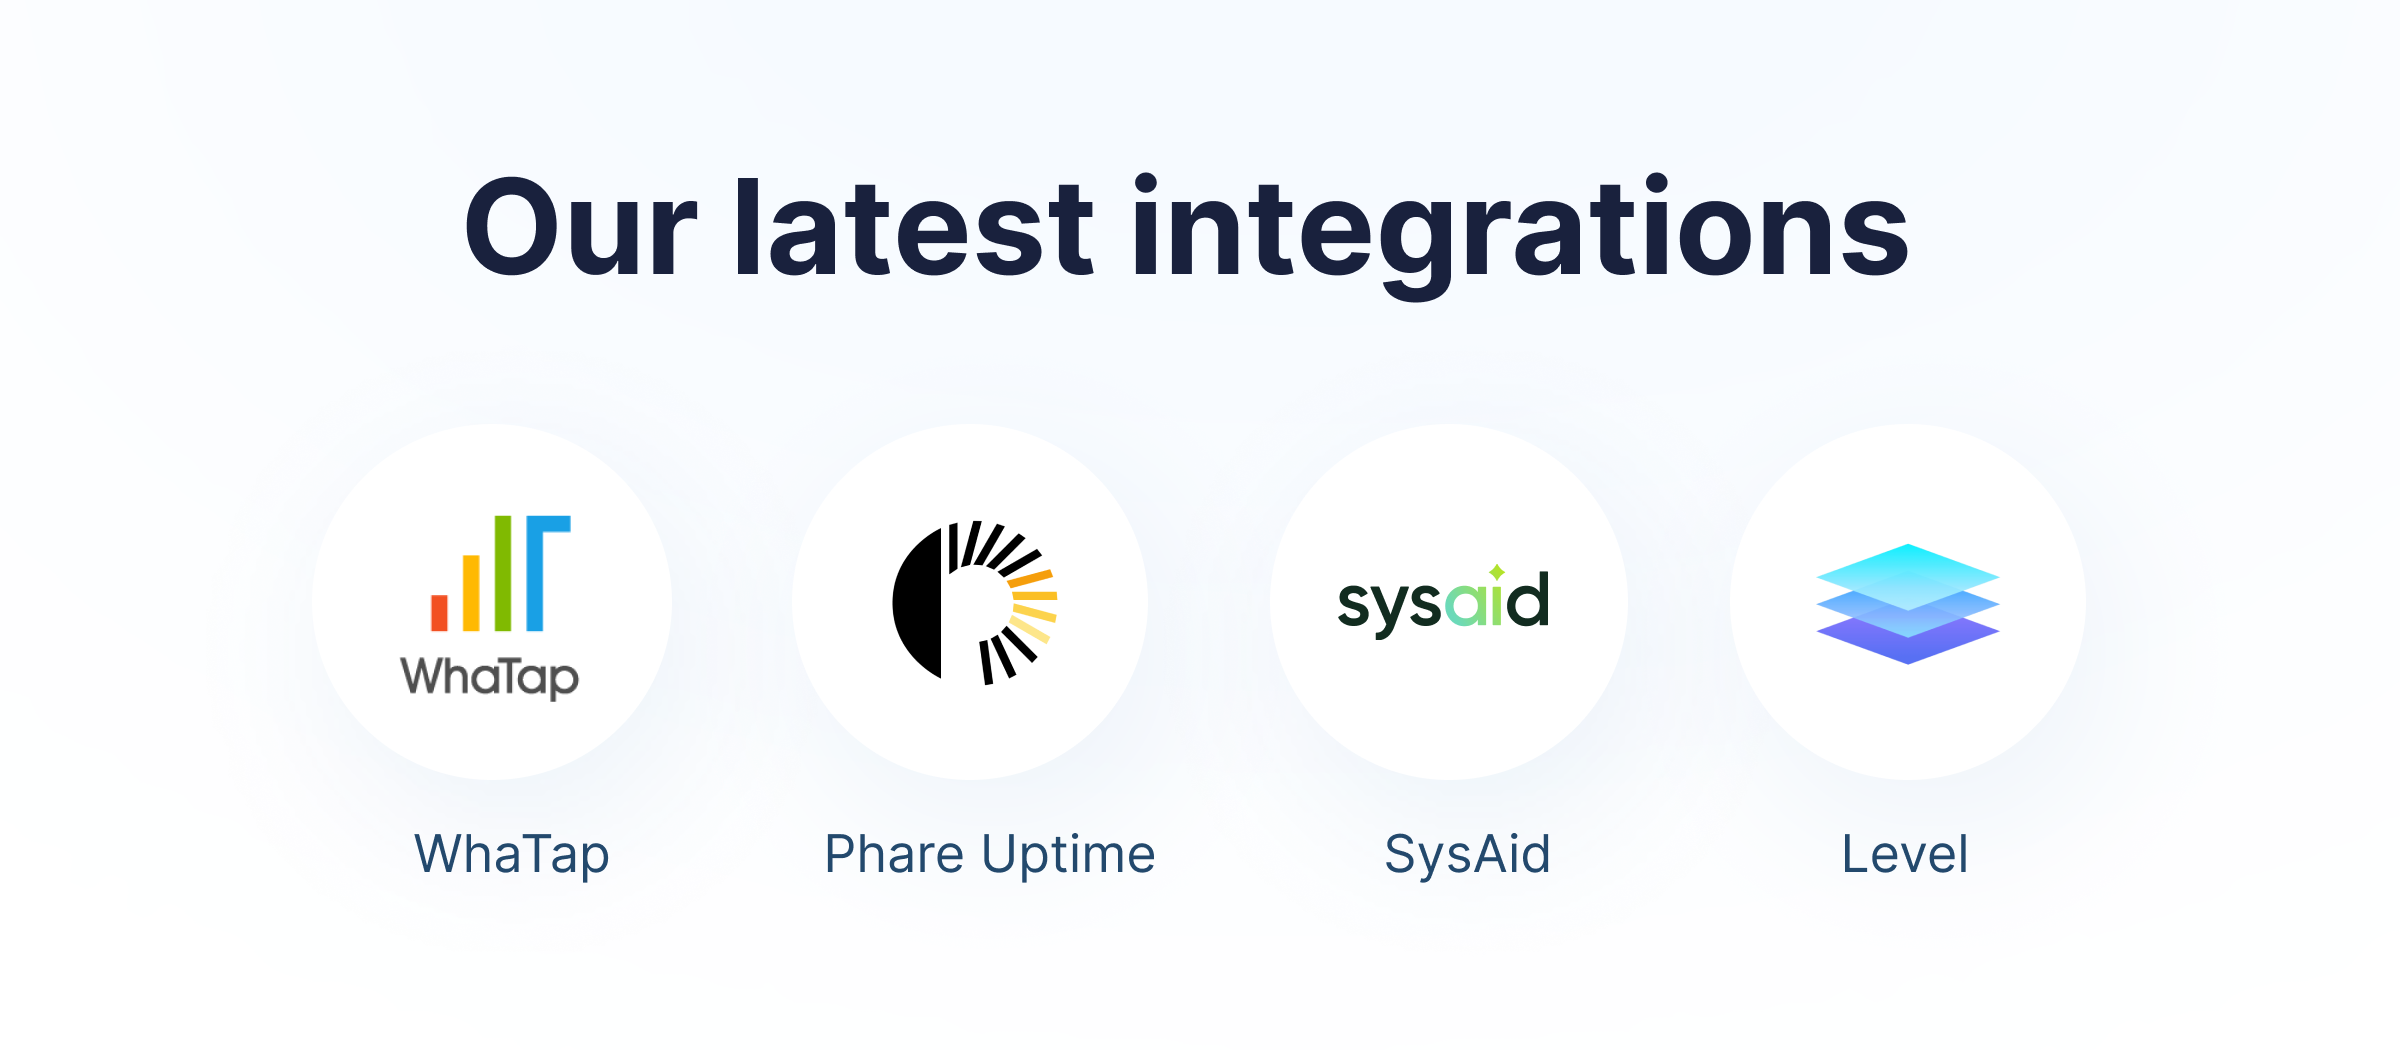
New integrations
WhaTap: an AI-native observability platform. As a SaaS-based unified IT monitoring service provider, it offers comprehensive monitoring across a wide range of IT environments.
Phare Uptime: is a reliable, privacy-focused monitoring service that keeps a close eye on your websites, APIs, and SSL certificates.
SysAid: an AI-native ITSM platform built to automate the heavy lifting of modern IT. Uses built-in AI to prioritize tasks, summarize ticket histories, and provide instant resolutions to end users and IT admins.
Level: a modern remote monitoring and management (RMM) platform built for IT teams and MSPs who prefer to work smarter and stay ahead of issues.


.png)
.png)
.png)
.png)
.png)
.png)