Event Transparency: Enterprise Scale Alert Debugging with ilert’s Event Explorer
.avif)
At ilert, one of the key tools in our debugging process is the Event Explorer, which provides an extensive overview of incoming events and their processing lifecycle. By reflecting the event process of an alert source, the Event Explorer allows our team to trace event paths, correlate related data, and identify issues quickly. This type of debugging, focused on event transparency, helps us quickly investigate the root cause and resolve issues, ensuring the ilert platform's functionality, stability, and reliability.
In this article, I will explain more about the capabilities of Event Explorer.
The challenges of debugging without event transparency
Debugging in a large-scale system becomes significantly more challenging when system events are not fully transparent or easily accessible. In our platform, events can be spread across various components and systems, making it difficult to maintain a clear, unified view of what is happening. Some of the main difficulties include:
- Fragmented Data. Event logs scattered across services make it hard to get the full picture.
- Time-Consuming Correlation. Manually linking events slows down the troubleshooting process.
- Missed Context. Without a unified view, important information could be missed, therefore complicating resolution.
We faced these challenges, particularly when customers reached out with specific edge cases related to alert sources that had never been considered before.
Event Explorer capabilities
The Event Explorer is available for all alert sources and shows what happened with incoming raw events as they were processed into alerts. We developed it to help customers gain precise clarity, troubleshoot event-related issues on our platform more efficiently, and empower our support team to assist effectively when customers reach out regarding unexplainable anomalies.
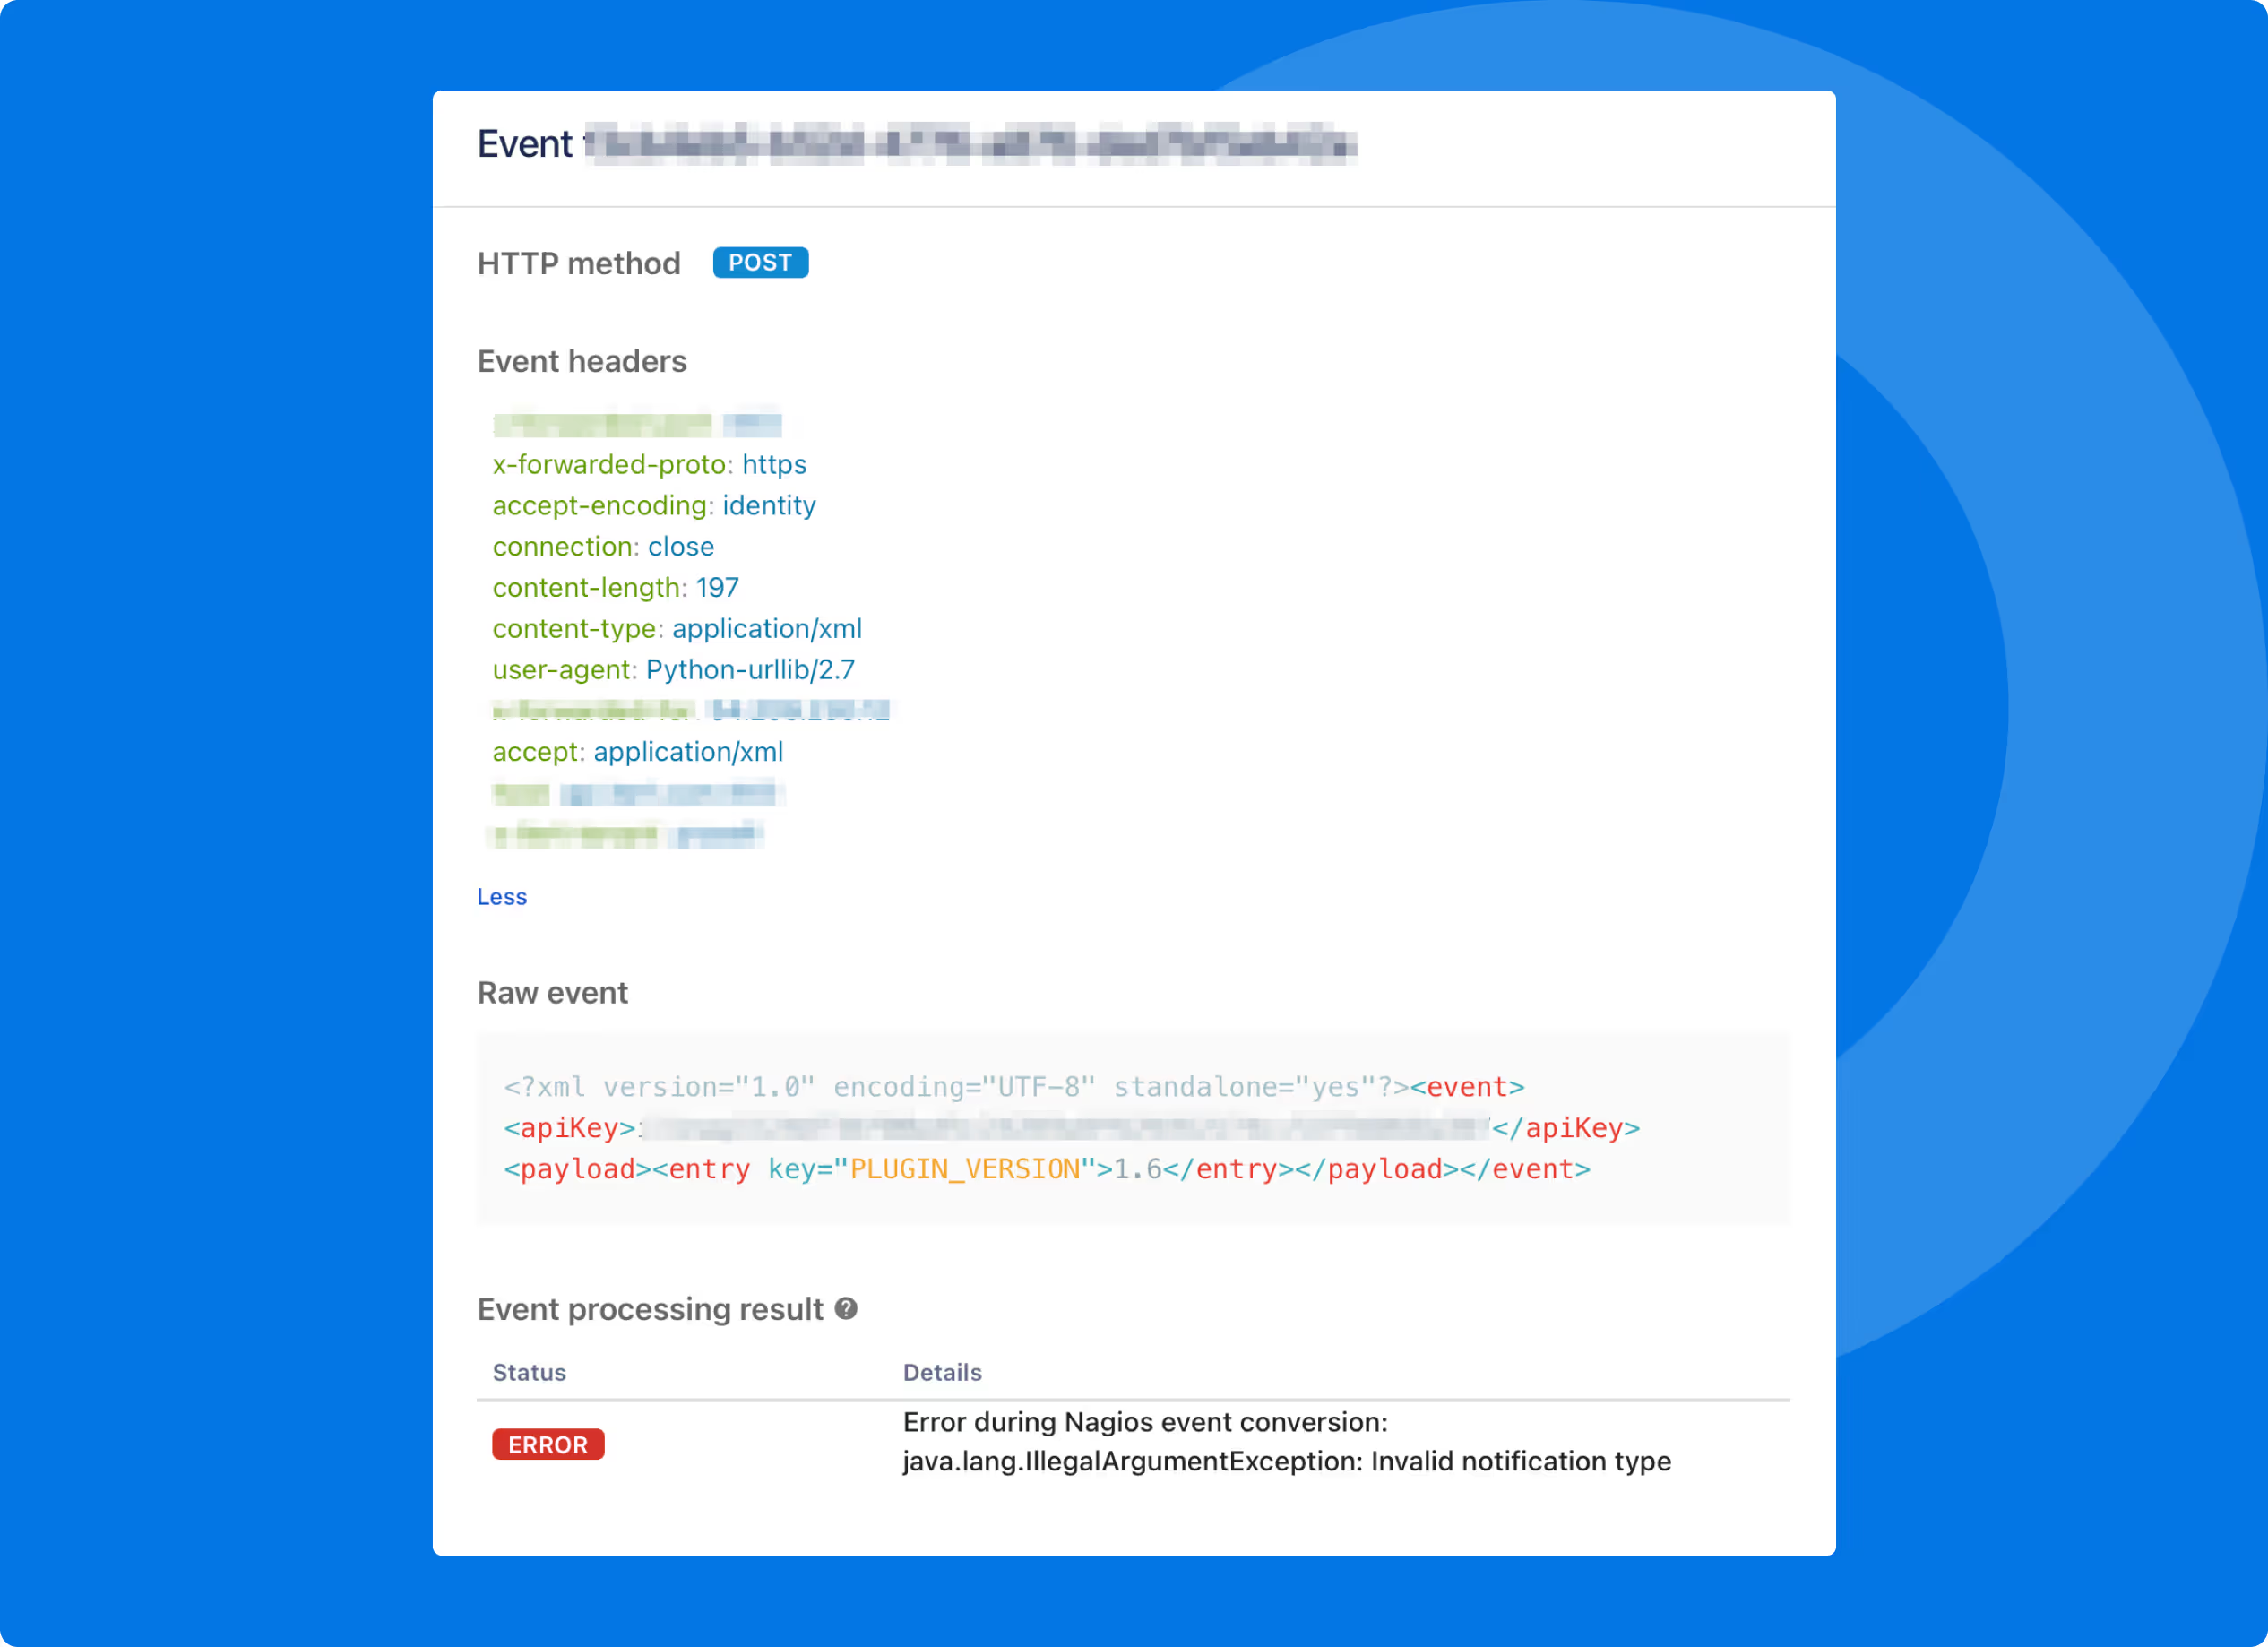
ilert Event Explorer returns full information about the incoming request, including event headers and payload. If an error occurs while processing, it displays the error information. If successful, the correlated converted event is displayed as an ilert alert. It also gives information about events being converted, for example, if it got appended due to alert grouping settings.
.avif)
Here is a real-life scenario in which the Event Explorer came into action:
A customer contacted us because they hadn't received any notifications while testing our Nagios integration. When we asked for an alert ID to check our logs, they replied that no alerts had been created, which pointed to an issue in the event processing. Using the ilert Event Explorer, we discovered that the incoming request's payload missed the necessary keys and values for Nagios event conversion in ilert. It appeared that the enable_environment_macros macro in their Nagios configuration was disabled, preventing access to those variables. After enabling this macro, the customer started receiving alerts and notifications.

From request to Event Explorer: Tracing the journey of an Event
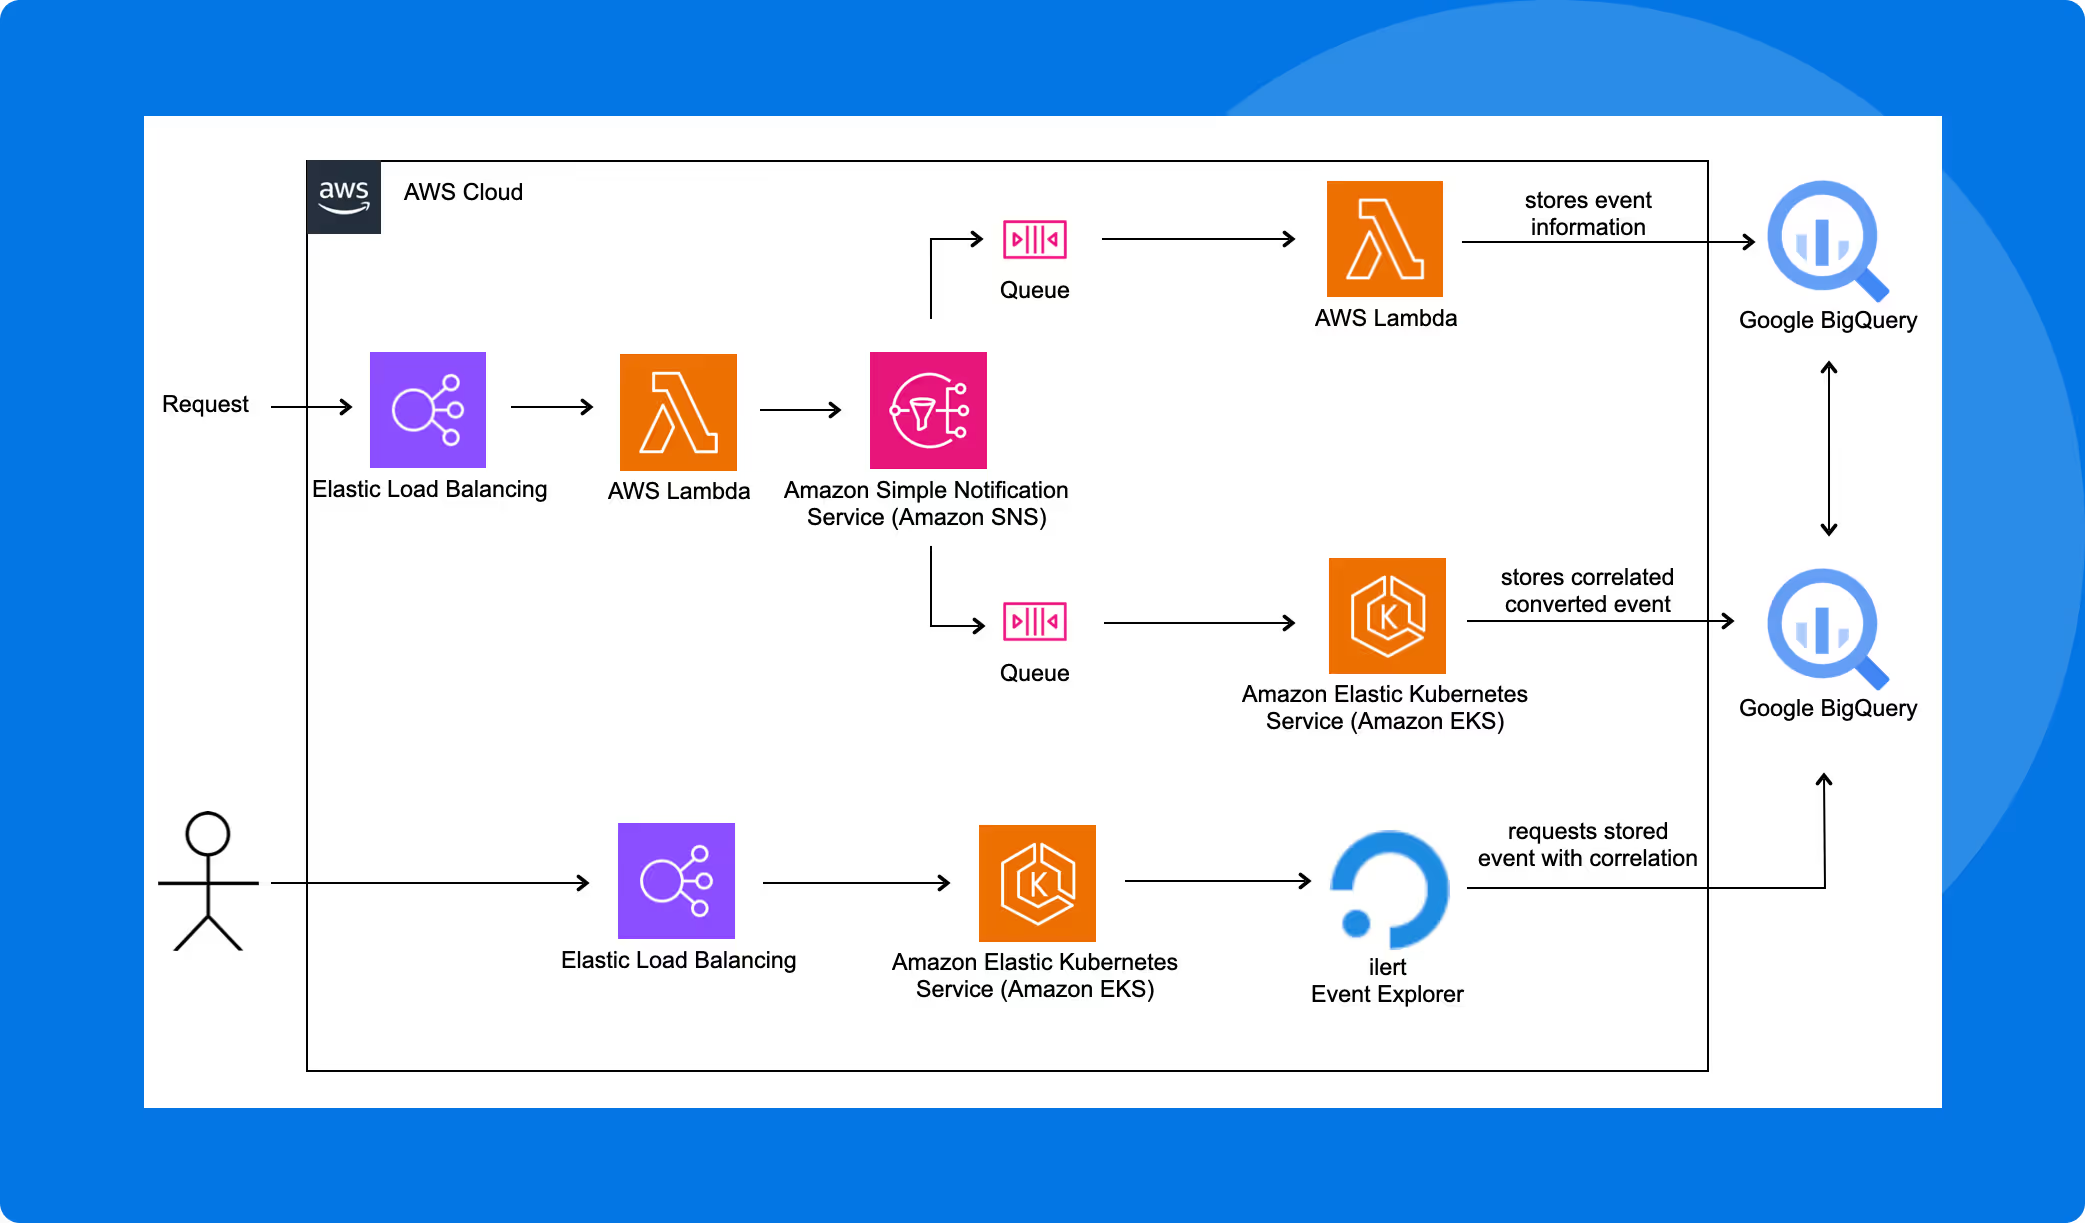
When an incoming request is sent to AWS ELB, a Lambda function validates the request and publishes a message to an SNS topic, which then delivers it to SQS queues. From there, another Lambda function consumes the message and stores the request information in Google BigQuery. Meanwhile, the event is processed by an EC2 instance, which converts it into an alert in ilert. The ilert Event Explorer then retrieves correlated request information from Google BigQuery.

Conclusion
At ilert, we believe that event transparency is important for simplifying debugging and improving system stability. One of our primary use cases for event transparency is the Event Explorer, which reflects the event processing of an alert source by offering detailed insight into how raw events are converted. The Event Explorer offers both our clients and us an overview of incoming events, enabling quick tracing, understanding, and resolution of anomalies.


.avif)


.avif)


