

An ultimate step-by-step guide on Zabbix Cloud Monitoring
.png)


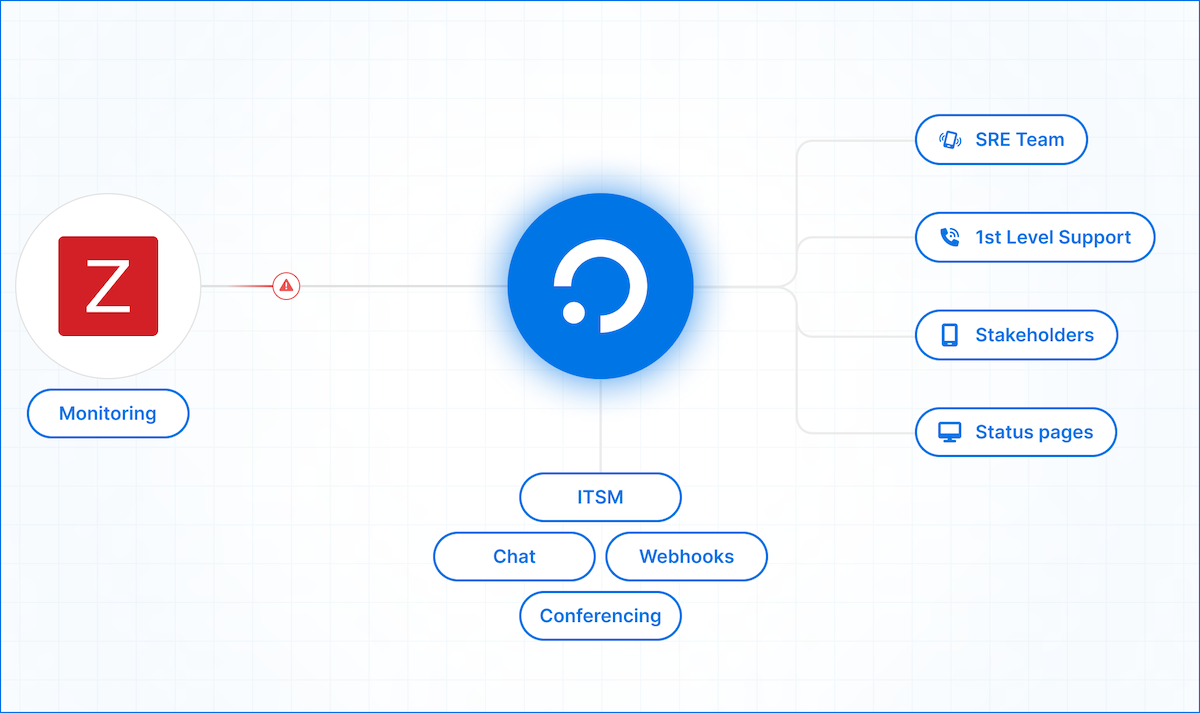
Learn how to set up Zabbix Cloud for AWS Auto-Discovery and receive critical alerts via SMS, phone calls, or push notifications.
During the last Zabbix Summit, the company presented a cloud version of its well-known monitoring platform. We at ilert constantly see the growing popularity of Zabbix as more and more teams across the globe utilize it for their monitoring needs. To help users quickly adopt the new cloud version, we delivered this guide.
Why Zabbix
Maintaining the functionality and health of cloud infrastructure, such as servers, virtual machines, databases, containers, and apps, is essential for companies of different sizes. Zabbix Cloud Monitoring is an effective instrument for keeping an eye on all these resources across well-known cloud providers like Google Cloud Platform (GCP), Microsoft Azure, and Amazon Web Services (AWS).
Zabbix Cloud Monitoring gives businesses proactive alerting, automatic anomaly detection, and real-time insight into their cloud infrastructures. In contrast to conventional monitoring solutions, Zabbix combines agent-based and agentless techniques to monitor important performance indicators, identify problems before they become more serious, and guarantee peak system performance.
What this guide covers
This step-by-step guide will help you:
- Set up and configure Zabbix Cloud Monitoring for AWS Auto-Discovery;
- Integrate cloud services using API-based monitoring for full visibility
- Create dashboards to proactively manage your infrastructure;
- Receive critical Zabbix alerts via multiple channels, like SMS, phone calls, messenger, or push notifications with the help of ilert.
Prerequisites: What you will need to follow this guide
- A registered account on Zabbix Cloud;
- A Zabbix Cloud instance deployed and accessible via a web browser;
- AWS Account with API Access;
- IAM (Identity and Access Management) Policy: you need to create an IAM policy for the Zabbix role in your AWS account with the necessary permissions;
- CloudWatch Metrics: Ensure that CloudWatch metrics are enabled for your AWS resources, such as EC2 instances, RDS databases, and S3 buckets, to provide monitoring data.
Stage 1: Creating an IAM Policy for Zabbix
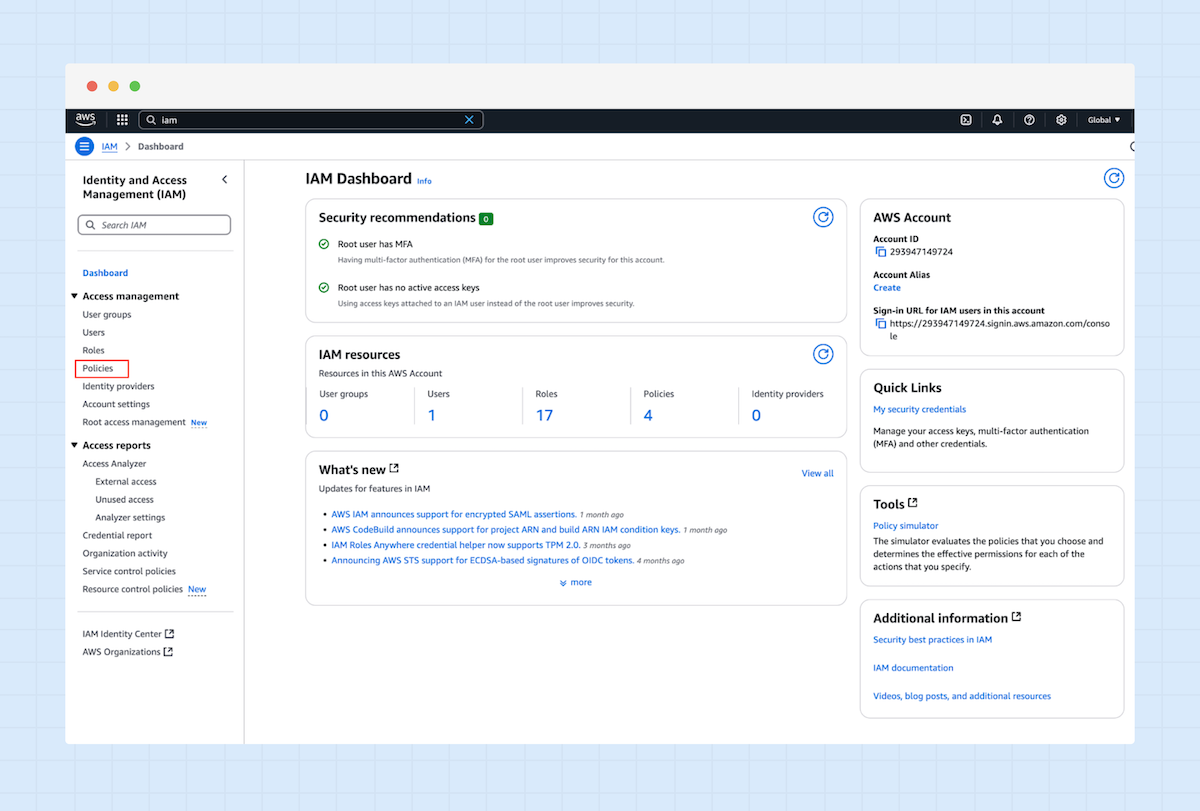
1. In AWS, open the IAM service and click “Policies.”
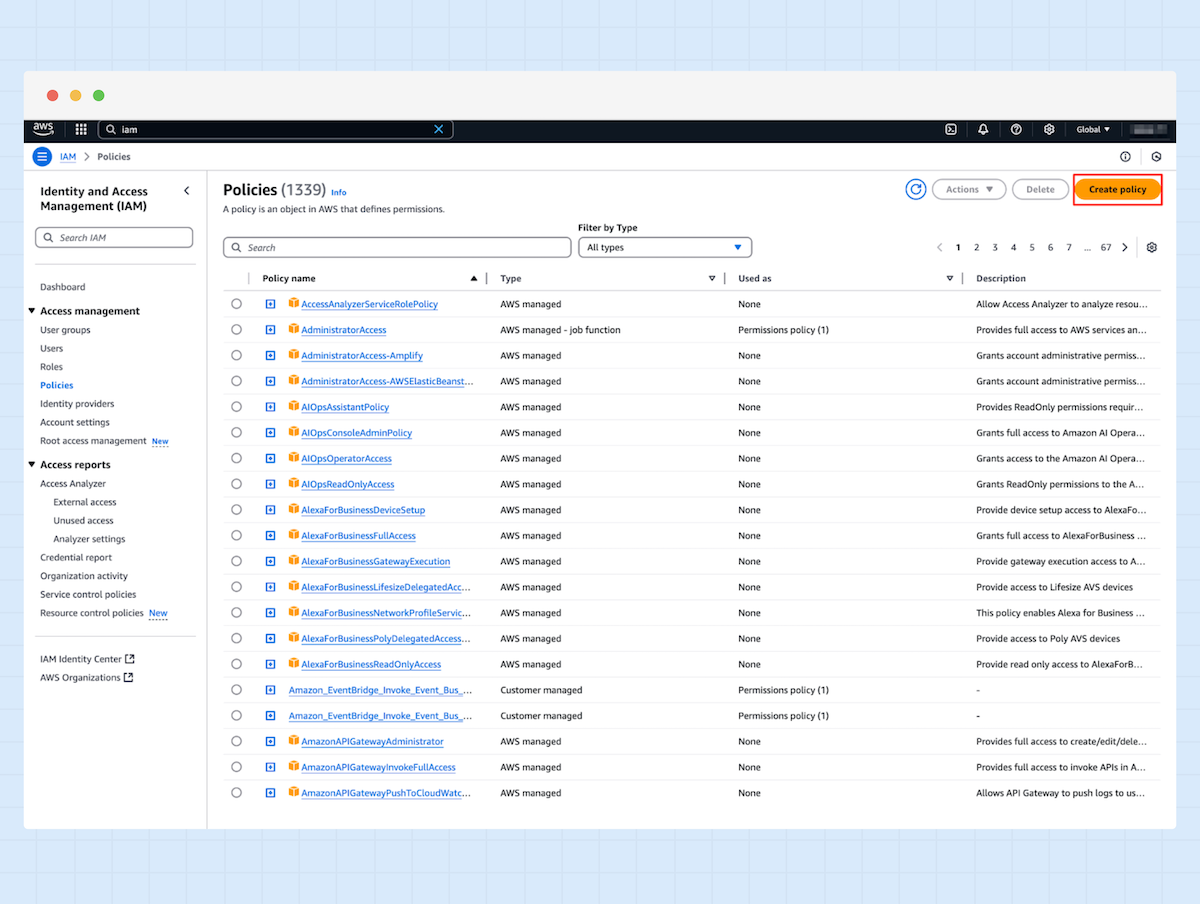
2. On the top right corner, click “Create policy.”
3. Select “JSON” and add the following configuration to the policy editor.
1{
2    "Version": "2012-10-17",
3    "Statement": [
4        {
5            "Action": [
6                "cloudwatch:Describe*",
7                "cloudwatch:Get*",
8                "cloudwatch:List*",
9                "ec2:Describe*",
10                "rds:Describe*",
11                "s3:ListAllMyBuckets",
12                "s3:GetBucketLocation"
13            ],
14            "Effect": "Allow",
15            "Resource": "*"
16        }
17    ]
18}

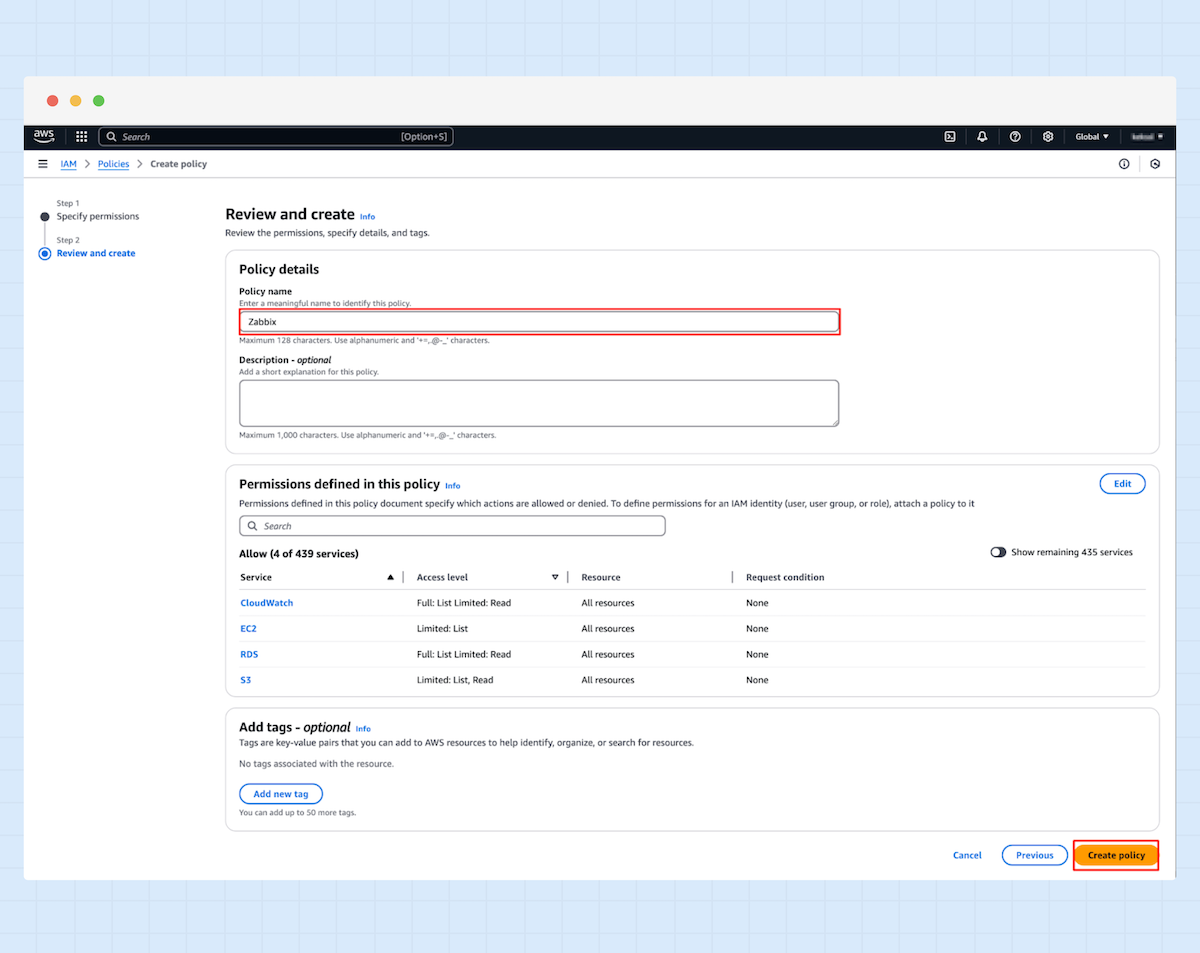
4. Enter a new name for the policy and click “Create policy.”
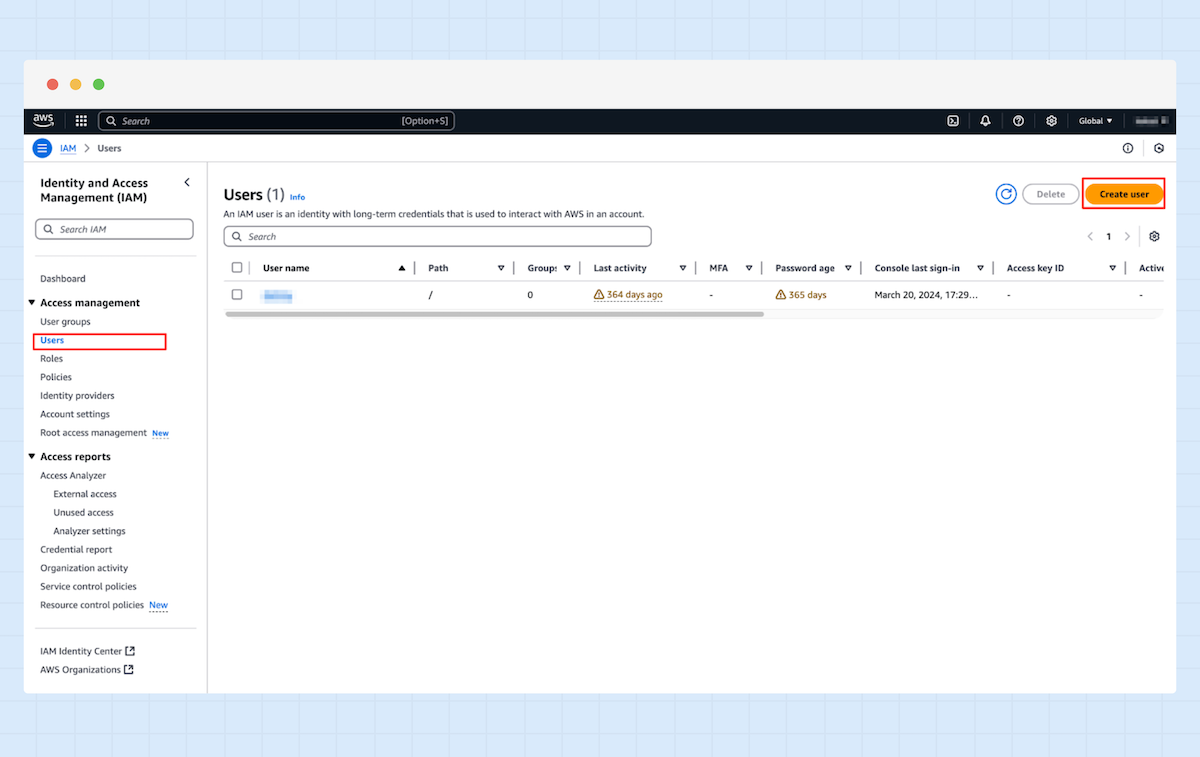
5. Now, navigate to Users and click “Create user.”
6. Enter a user name and click “Next.”
7. Choose “Attack policies directly” in the Permission options and select the Zabbix policy.

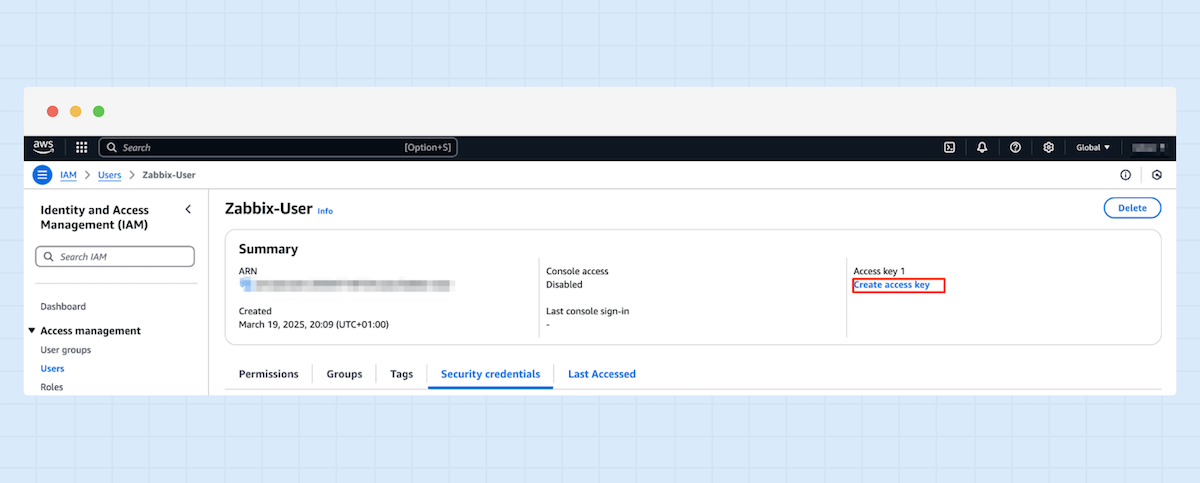
8. Navigate to the created user and create a new access key.
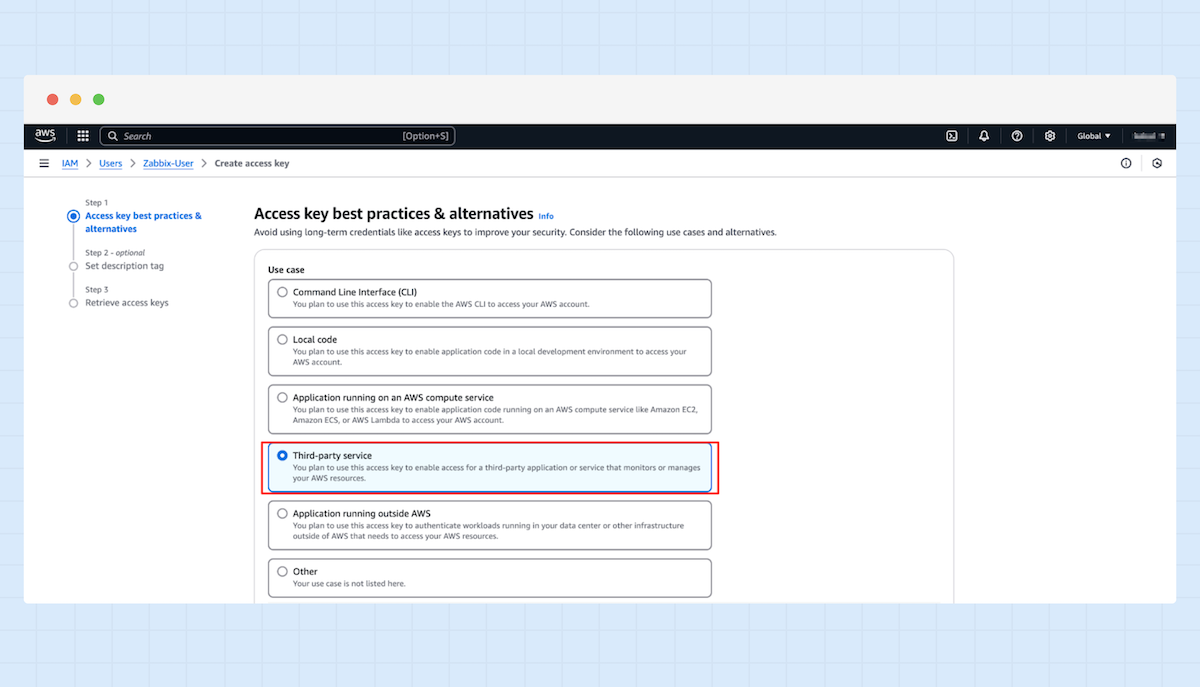
9. Choose “Third-party service” and proceed to the next step.
10. An Access and a Secret access key have been created, which you will need in your Zabbix configuration.

Stage 2: Creating an AWS Discovery host in Zabbix Cloud
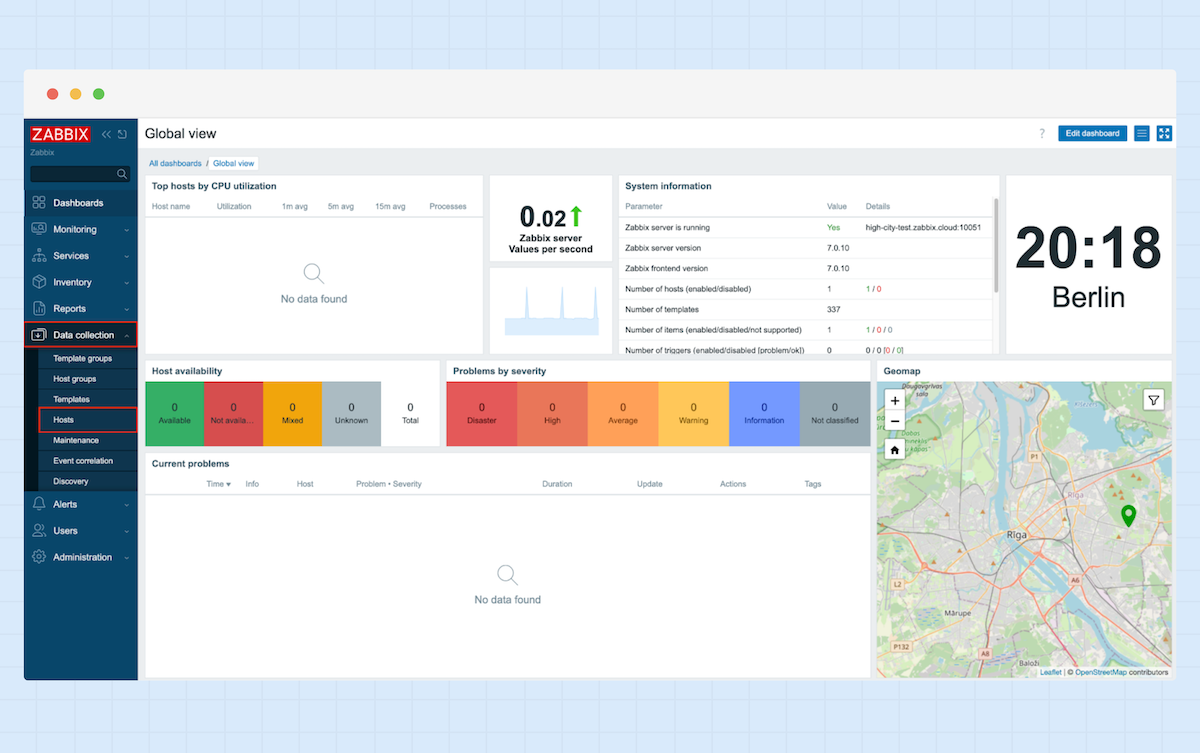
1. On the sidebar, navigate to “Data Collection” and select “Hosts.”
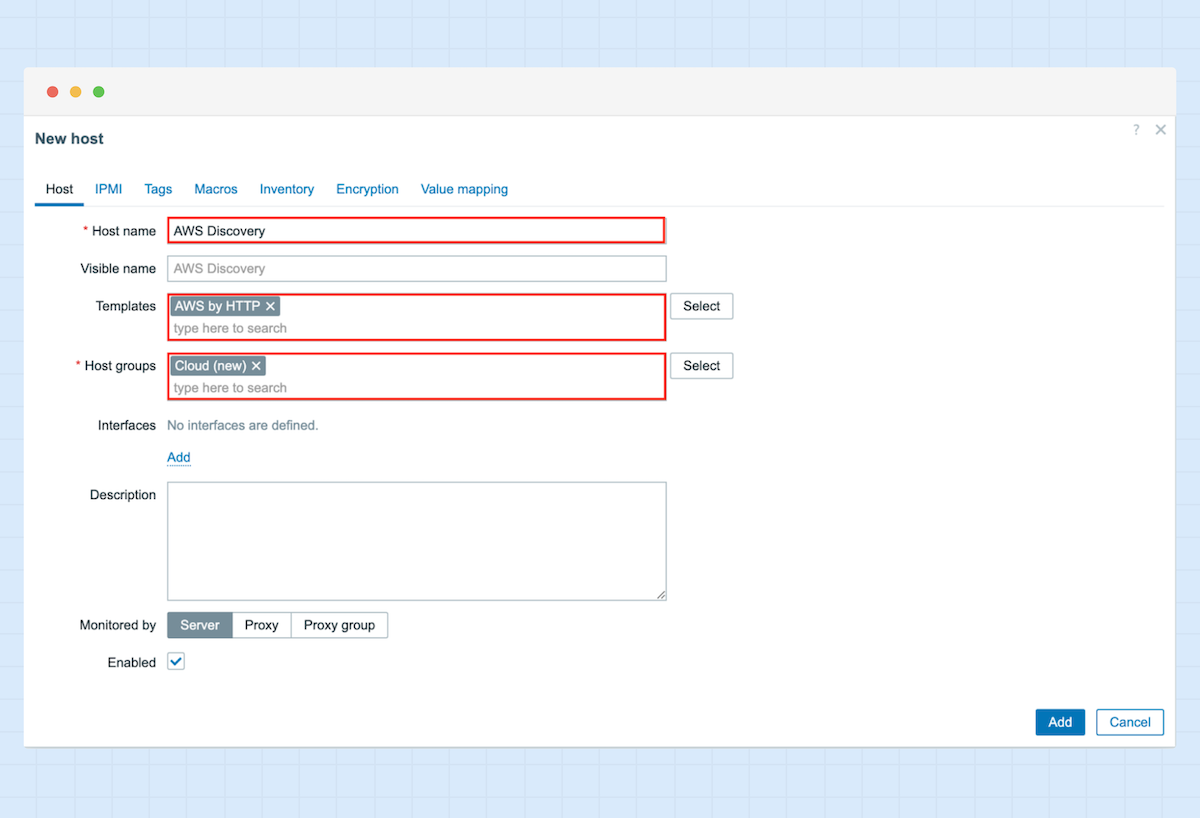
2. Enter a name for your Host, select AWS by HTTP as a template, add a Host group, and click “Add.”
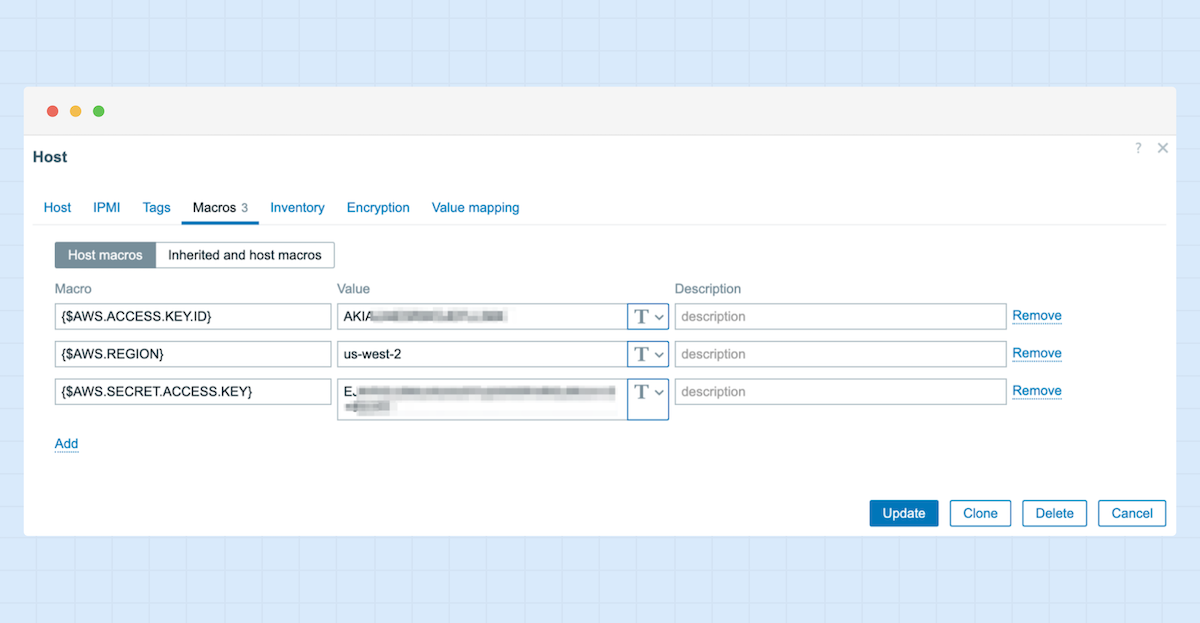
3. Now, reopen the newly created Host and navigate to “Macros.” Add the following Macros: {$AWS.ACCESS.KEY.ID} {$AWS.REGION} {$AWS.SECRET.ACCESS.KEY} and fill the values with the Access key, Region, and the Secret access key.
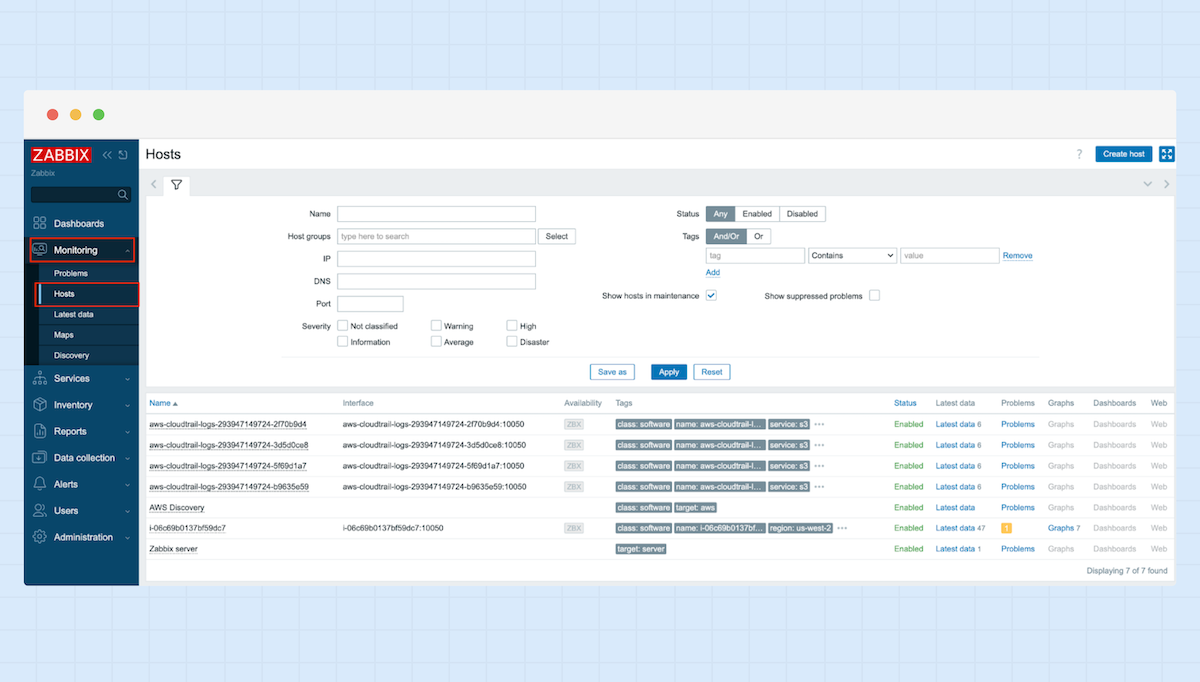
4. Find the “Hosts” section in the “Monitoring” tab again; you can now see your hosts.

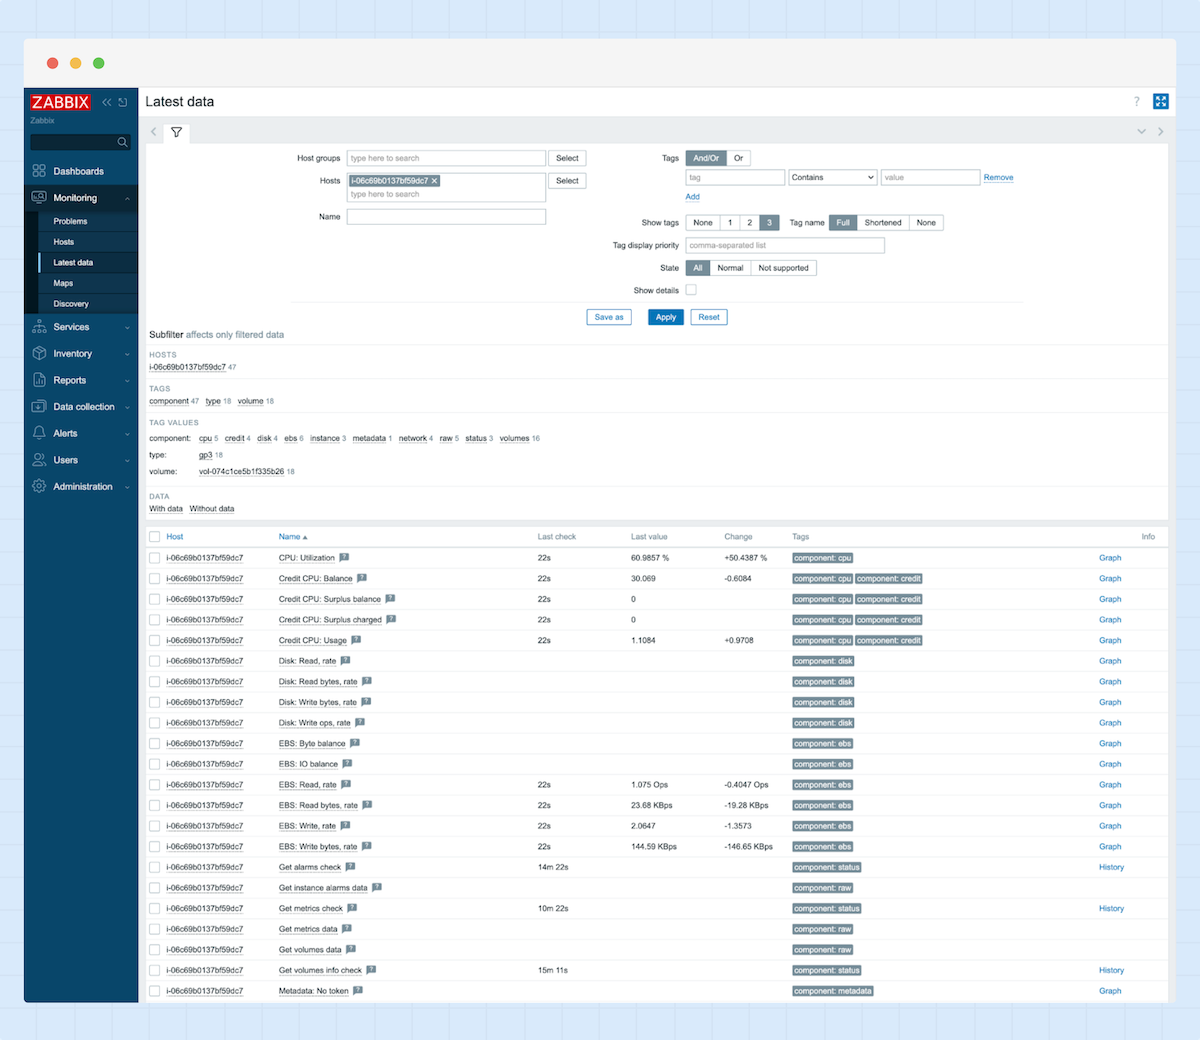
5. By clicking “Latest Data,” you can now see all the latest data received from your AWS EC2 instance.
Zabbix Dashboards
Zabbix Dashboards provide an easy-to-use interface for monitoring your infrastructure, including cloud environments. They give you an extensive overview of key metrics in one location, including database performance, storage usage, server health, and cloud resources.
Using Zabbix Dashboards for infrastructure and cloud monitoring, you can keep track of your resources more effectively. Key features of the dashboards are:
- Customizable layout
- Real-time monitoring
- Various widget types (graphs, availability, status, maps, etc.)
Configuring Monitoring Dashboards
After setting up auto-discovery for AWS resources and integrating your AWS environment with Zabbix Cloud Monitoring, you may create monitoring dashboards to get complete insight into your cloud architecture.
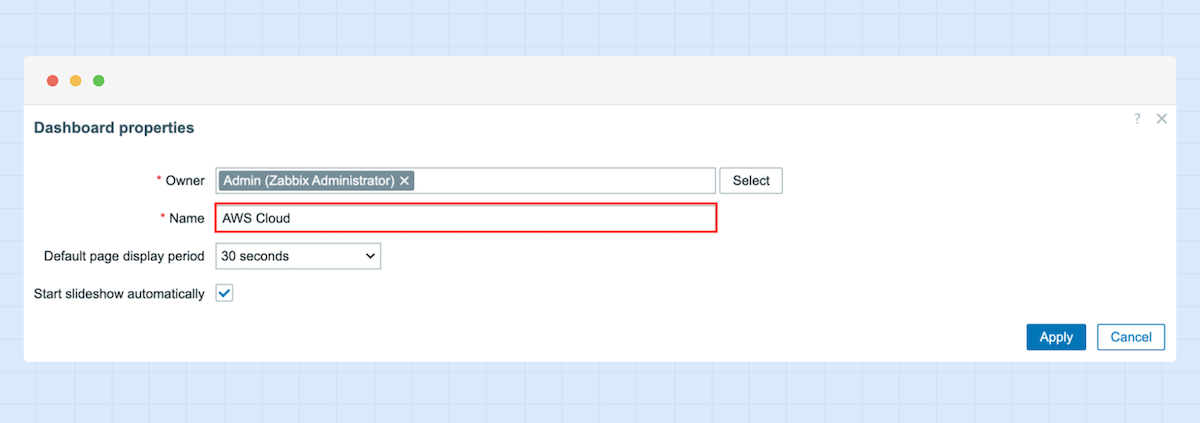
1. Navigate to Dashboards and click “Create dashboard.”

2. Add a name and choose the owner of the new dashboard.
3. You can now add various widgets like graphs, maps, charts, availability status, and more to your dashboard.

Triggers and media types in Zabbix Cloud
Triggers and media types are essential for proactive monitoring. They enable you to automatically identify problems with your Cloud infrastructure, such as high CPU usage, low disk space, or service outages, and promptly alert you when it's crucial.
What are Triggers?
Triggers in Zabbix are expressions that evaluate the data gathered from monitored items (such as CPU usage, memory usage, disk space, etc.). When a predefined threshold is reached or exceeded, a trigger is activated.
Trigger examples:
- CPU Utilization: A trigger could be set up to alert if an EC2 instance’s CPU usage exceeds 85% for more than 5 minutes.
- Disk Space Usage: A trigger could be set to notify if an EC2 instance’s disk usage exceeds 90%.
Configuring Triggers
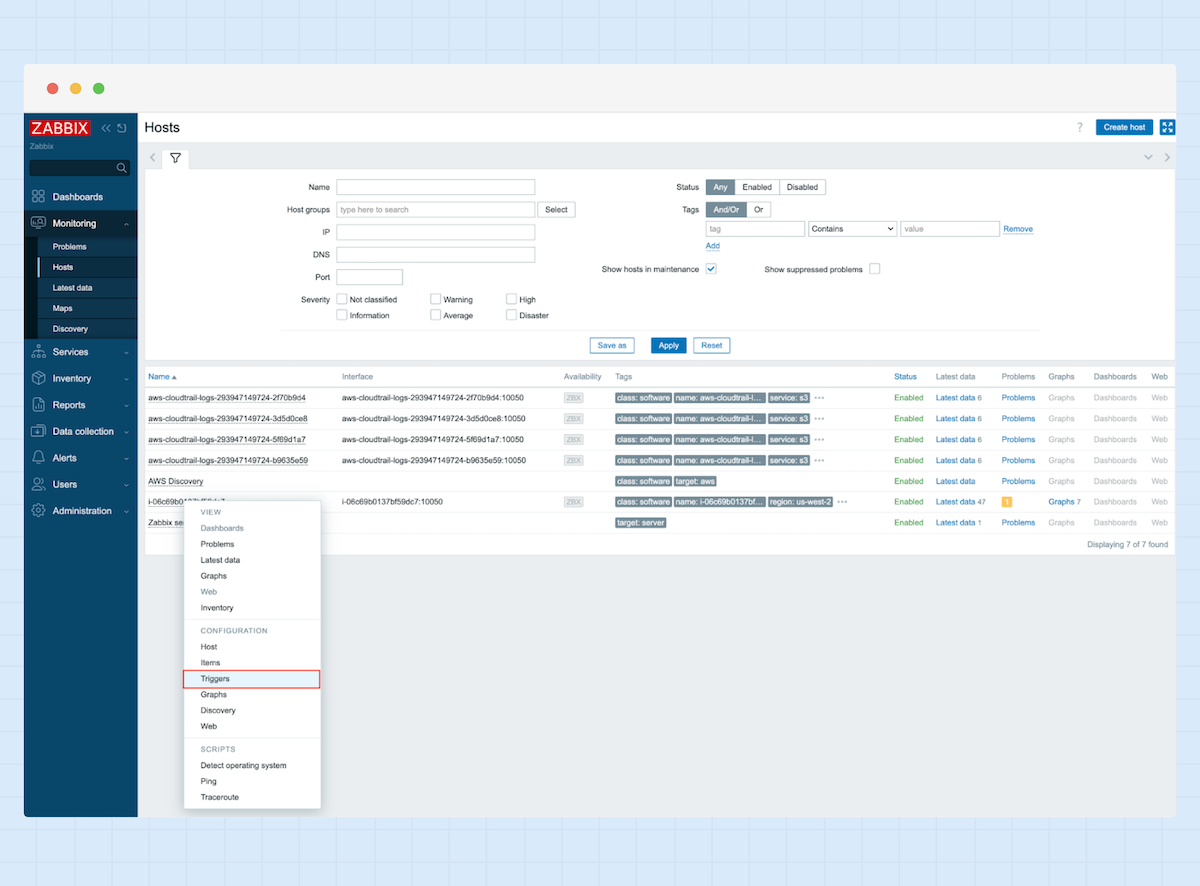
1. Navigate to “Monitoring,” then “Hosts.”
2. Select the host for which you want to create a trigger and click “Triggers” under the “Configuration” section.
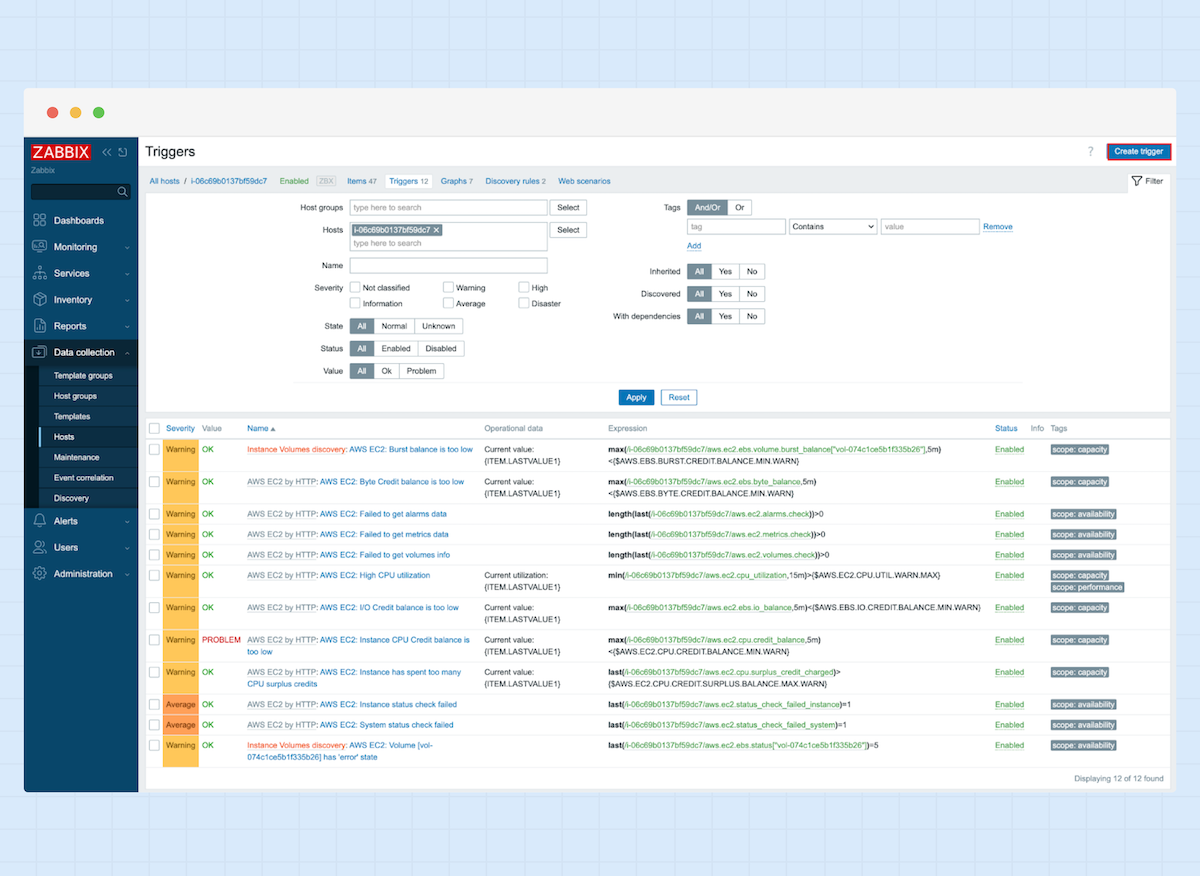
3. Now click “Create trigger.”
4. In this example, I’ll configure a CPU usage trigger.
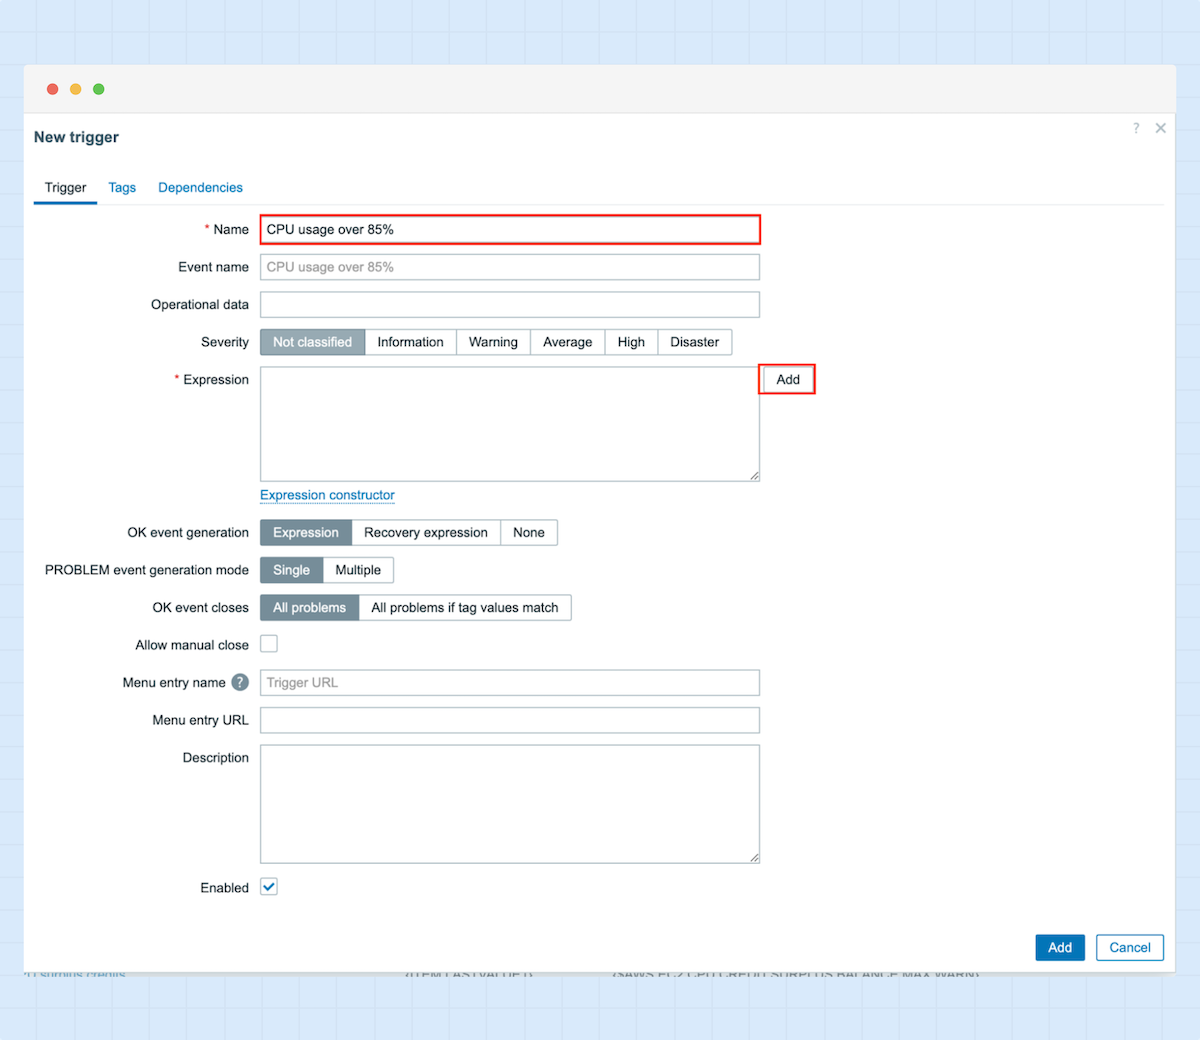
5. After entering the trigger name, we can now add the expression. In this case, it will set the severity to “High” whenever the CPU usage is above 85% and will recover when the CPU usage falls below 80%.

What are Media types?
In Zabbix, Media types relate to the different options for receiving notifications or alerts when a trigger is active. A Media type specifies how and through which channels Zabbix will send notifications to users.
Zabbix supports a variety of media types, allowing you to customize alerting according to your preferences or requirements. Some common Media types include:
- Email: Send notifications via email to alert users of any issues.
- SMS: Send text messages (SMS) for mobile alerts.
- Webhook: Trigger a custom action or integrate with third-party systems via webhooks.
- Third-party integrations: Use external services or platforms, such as ilert, to route alerts to specific teams or applications, ensuring a smooth integration into your existing incident management processes.
Stage 3: Connect Zabbix with ilert using the ilert Media type
To connect Zabbix with ilert, create a new User in Zabbix and add ilert as a Media type.
Add the Integration key of your Zabbix alert source into the Send to field.
For further information, please refer to ilert's Zabbix Integration Guide.


